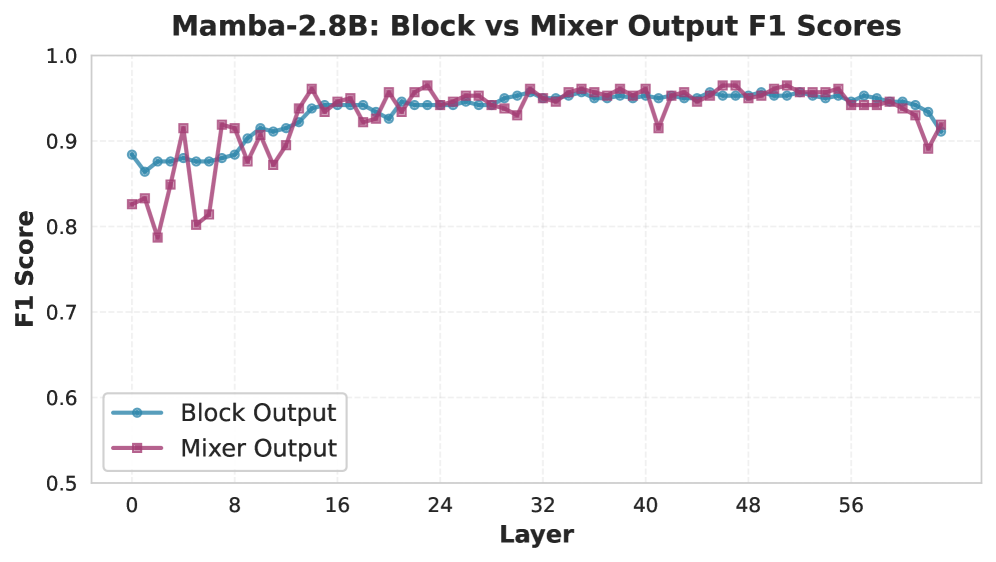
## Line Chart: Mamba-2.8B Block vs Mixer Output F1 Scores
### Overview
The chart compares F1 scores between "Block Output" (blue line) and "Mixer Output" (purple line) across 58 layers in the Mamba-2.8B model. Both lines exhibit similar trends with minor fluctuations, converging toward higher F1 scores as layers increase.
### Components/Axes
- **X-axis (Layer)**: Discrete values from 0 to 58, labeled "Layer".
- **Y-axis (F1 Score)**: Continuous scale from 0.5 to 1.0, labeled "F1 Score".
- **Legend**: Located at bottom-left, with:
- Blue circles: "Block Output"
- Purple squares: "Mixer Output"
- **Grid**: Light gray dashed lines for reference.
### Detailed Analysis
1. **Block Output (Blue)**:
- Starts at ~0.88 (layer 0), dips to ~0.87 (layer 2), then rises steadily.
- Peaks at ~0.94 (layer 16), stabilizes between ~0.94–0.95 (layers 24–40).
- Declines slightly to ~0.92 (layer 58).
2. **Mixer Output (Purple)**:
- Begins at ~0.82 (layer 0), spikes to ~0.95 (layer 16).
- Fluctuates between ~0.93–0.95 (layers 24–40), with a dip to ~0.90 (layer 40).
- Stabilizes at ~0.93–0.94 (layers 48–56), ending at ~0.91 (layer 58).
### Key Observations
- Both lines show an initial rise to ~0.94–0.95 by layer 16, followed by stabilization.
- Mixer Output exhibits sharper fluctuations (e.g., dip at layer 40) compared to Block Output.
- Convergence occurs after layer 40, with both lines maintaining ~0.92–0.94 F1 scores.
### Interpretation
The chart suggests that Mixer Output initially outperforms Block Output in early layers (up to layer 16) but experiences volatility in mid-layers (e.g., layer 40 dip). Block Output demonstrates steadier performance after layer 16. The convergence in later layers implies diminishing differences between the two methods as layer depth increases. The dip in Mixer Output at layer 40 may indicate architectural or computational inefficiencies in that specific layer. Overall, both methods achieve high F1 scores (>0.9), with Mixer Output showing marginally higher performance in early layers.