## Line Chart: GPU Throughput vs. Hidden Size
### Overview
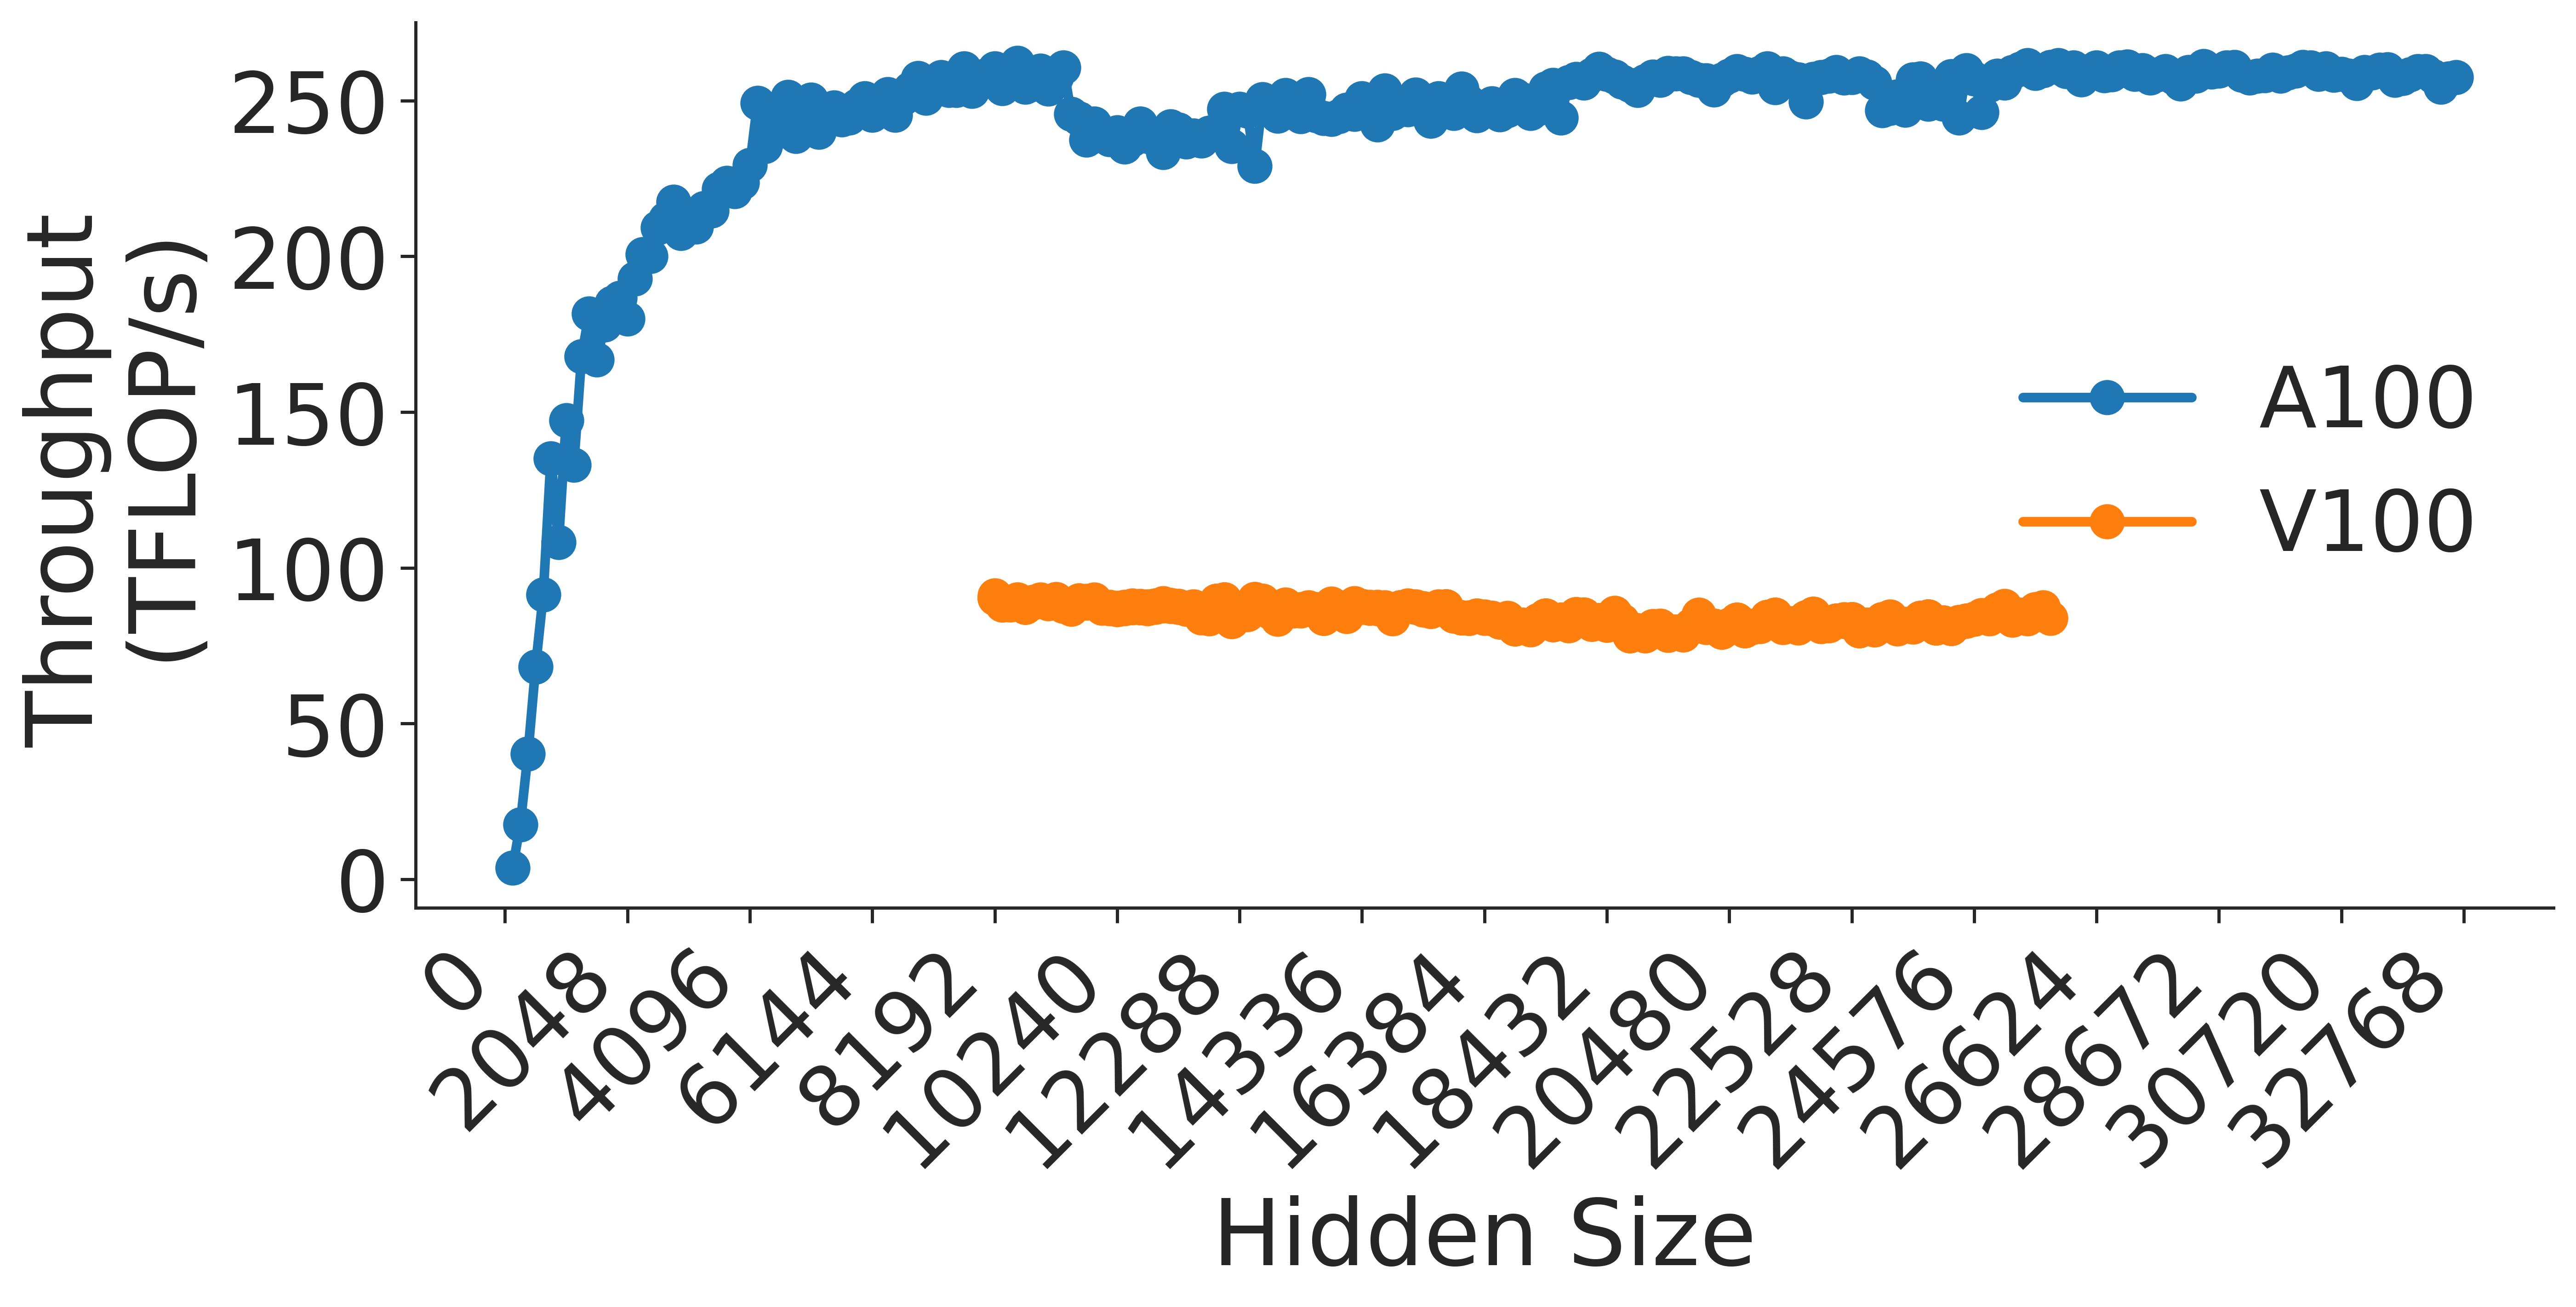
This chart illustrates the performance comparison between two GPU architectures, the NVIDIA A100 and the NVIDIA V100, by plotting their throughput (measured in TFLOP/s) against varying "Hidden Size" parameters. The chart demonstrates that the A100 architecture achieves significantly higher throughput and requires a "warm-up" period at lower hidden sizes, whereas the V100 maintains a lower, stable throughput across the tested range.
### Components/Axes
* **Y-Axis (Vertical):** Labeled "Throughput (TFLOP/s)". The scale ranges from 0 to 250, with major tick marks at intervals of 50.
* **X-Axis (Horizontal):** Labeled "Hidden Size". The scale ranges from 0 to 32768. The specific tick labels are: 0, 2048, 4096, 6144, 8192, 10240, 12288, 14336, 16384, 18432, 20480, 22528, 24576, 26624, 28672, 30720, 32768.
* **Legend:** Positioned on the right-center of the chart area.
* **Blue line/dots:** Labeled "A100".
* **Orange line/dots:** Labeled "V100".
### Detailed Analysis
#### Data Series: A100 (Blue)
* **Trend Verification:** The A100 series exhibits a steep, near-linear upward slope starting from 0, reaching a plateau around a hidden size of 6144. Following this, the trend remains relatively flat with minor fluctuations.
* **Data Points:**
* **0 to ~6144:** Rapid growth. Throughput rises from ~5 TFLOP/s at the origin to ~250 TFLOP/s.
* **~6144 to 32768:** The throughput plateaus. It oscillates slightly between approximately 230 TFLOP/s and 260 TFLOP/s for the remainder of the X-axis range.
#### Data Series: V100 (Orange)
* **Trend Verification:** The V100 series begins at a hidden size of 10240. The trend is essentially flat, showing very little variance across the entire range.
* **Data Points:**
* **10240 to 26624:** The throughput remains consistently between approximately 80 TFLOP/s and 90 TFLOP/s. There is no significant upward or downward slope; it is a stable performance profile.
### Key Observations
* **Performance Gap:** The A100 consistently outperforms the V100 by a factor of approximately 3x (roughly 250 TFLOP/s vs. 85 TFLOP/s).
* **Warm-up Phase:** The A100 shows a distinct "warm-up" phase where throughput increases with hidden size until it saturates the compute units around a hidden size of 6144.
* **Data Availability:** The V100 data is only plotted for hidden sizes 10240 and above, suggesting either the test did not run for smaller sizes or the hardware/software configuration for the V100 was not applicable below that threshold.
* **Stability:** The A100 shows slightly more volatility (fluctuations in the 230-260 range) compared to the V100, which maintains a very tight, consistent performance band.
### Interpretation
The data demonstrates a clear generational performance leap between the V100 and A100 architectures.
1. **Compute Saturation:** The A100's sharp initial rise indicates that it requires a minimum workload size (hidden size > 6000) to fully utilize its parallel processing capabilities. Below this, the overhead of the operation likely dominates the execution time.
2. **Architectural Ceiling:** The V100's flat line suggests that it hits its peak performance ceiling much earlier and maintains that throughput regardless of the increase in hidden size. It is likely memory-bandwidth bound or compute-bound at a lower threshold than the A100.
3. **Efficiency:** The A100 is significantly more efficient for large-scale matrix operations (implied by "Hidden Size"), making it the superior choice for workloads requiring high throughput, provided the hidden size is large enough to overcome the initial warm-up latency.