## Chart/Diagram Type: Analog Switching Characteristics of a ReRAM Device (Open-Loop)
### Overview
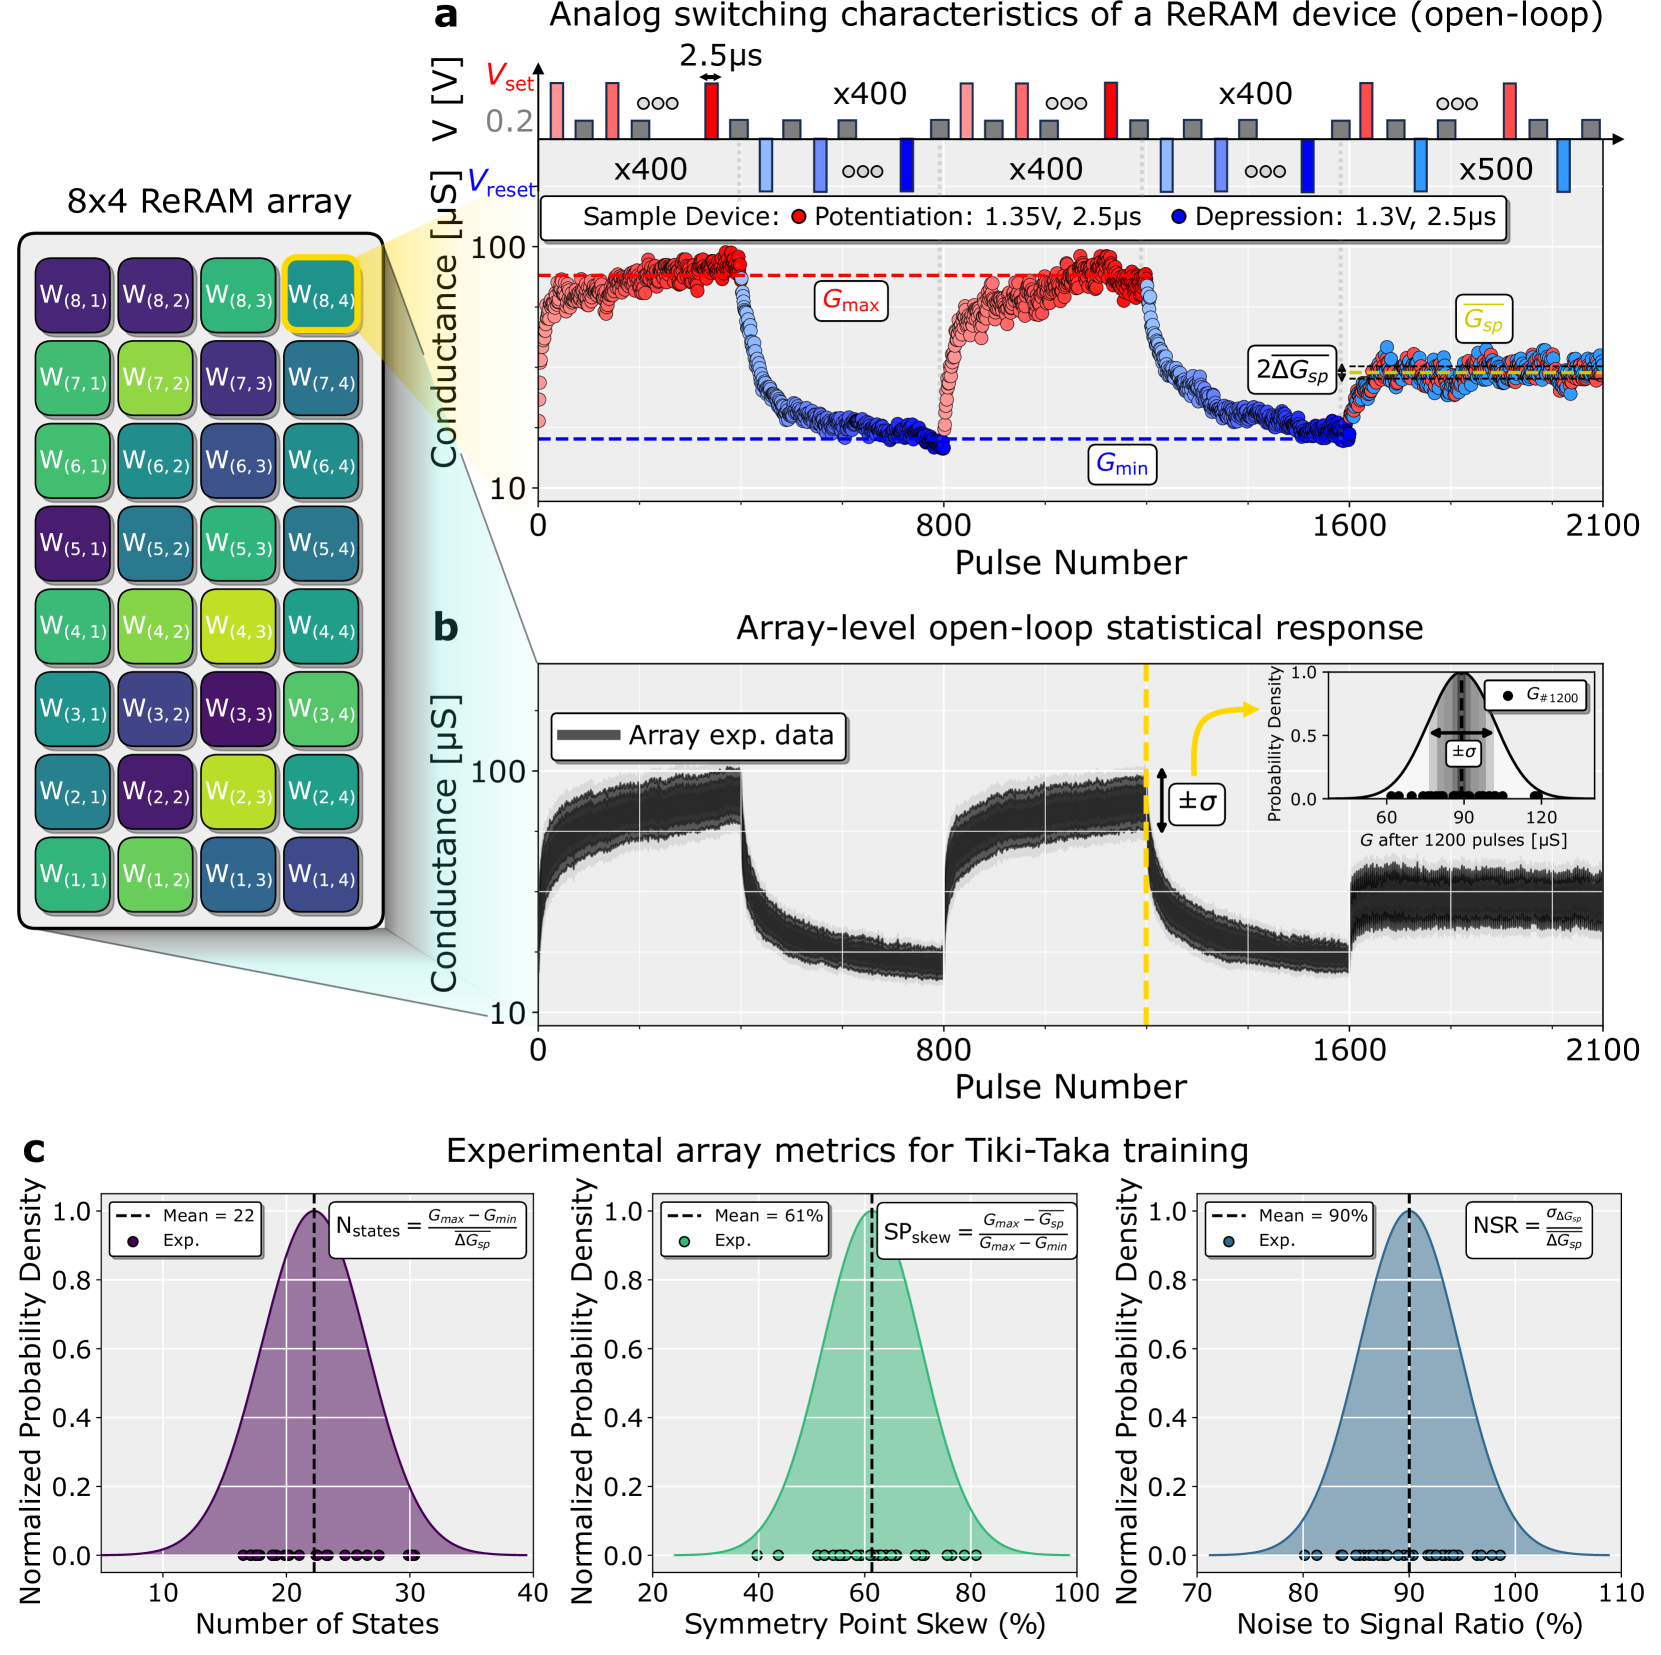
The image presents three interconnected technical visualizations analyzing a ReRAM (Resistive Random-Access Memory) device's behavior. Section **a** shows analog switching characteristics, **b** depicts array-level statistical responses, and **c** summarizes experimental metrics for Tiki-Taka training.
---
### Components/Axes
#### Section a: Analog Switching Characteristics
- **X-axis**: Pulse Number (0–2100)
- **Y-axis**: Conductance [μS] (logarithmic scale: 0–100)
- **Legend**:
- Red: Potentiation (1.35V, 2.5μs)
- Blue: Depression (1.3V, 2.5μs)
- **Inset**: Histogram of conductance after 1200 pulses (G₁₂₀₀) with ±σ shading.
#### Section b: Array-Level Open-Loop Statistical Response
- **X-axis**: Pulse Number (0–2100)
- **Y-axis**: Conductance [μS] (logarithmic scale: 0–100)
- **Legend**: Array experimental data (black line with ±σ shading).
- **Inset**: Histogram of conductance after 1200 pulses (G₁₂₀₀) with ±σ shading.
#### Section c: Experimental Array Metrics for Tiki-Taka Training
- **Histograms**:
1. **Number of States**: X-axis (0–40), mean = 22.
2. **Symmetry Point Skew (%)**: X-axis (20–110), mean = 61%.
3. **Noise to Signal Ratio (%)**: X-axis (70–110), mean = 90%.
- **Formulas**:
- N_states = (G_max - G_min) / ΔG_sp
- SP_skew = (G_max - G_sp) / G_max
- NSR = σΔG_sp / ΔG_sp
---
### Detailed Analysis
#### Section a
- **Potentiation (Red)**: Conductance increases sharply to ~100 μS at ~800 pulses, then stabilizes.
- **Depression (Blue)**: Conductance drops to ~10 μS at ~1600 pulses, then stabilizes.
- **Key Labels**:
- G_max ≈ 100 μS (potentiation peak).
- G_min ≈ 10 μS (depression trough).
- ΔG_sp ≈ 90 μS (difference between G_max and G_sp).
- G_sp ≈ 10 μS (conductance at symmetry point).
#### Section b
- **Array Data**: Conductance fluctuates between ~10 μS and ~100 μS, with ±σ shading indicating variability.
- **Inset Histogram**: Conductance distribution after 1200 pulses is approximately normal (G₁₂₀₀ ≈ 50 μS, ±σ ≈ ±10 μS).
#### Section c
- **Number of States**: Bimodal distribution with mean = 22.
- **Symmetry Point Skew**: Right-skewed distribution (mean = 61%).
- **Noise to Signal Ratio**: Left-skewed distribution (mean = 90%).
---
### Key Observations
1. **Conductance Switching**: Potentiation and depression create distinct conductance states (G_max ≈ 100 μS, G_min ≈ 10 μS).
2. **Statistical Variability**: Shaded regions in **b** indicate device-to-device or batch-to-batch variability.
3. **Training Metrics**:
- Tiki-Taka training increases the number of conductance states (mean = 22).
- Symmetry point skew (61%) and noise-to-signal ratio (90%) suggest trade-offs between precision and noise.
---
### Interpretation
- **ReRAM Behavior**: The device exhibits bistable conductance switching, critical for memory applications.
- **Array-Level Variability**: The ±σ shading in **b** highlights manufacturing or operational inconsistencies.
- **Tiki-Taka Training**: The metrics in **c** quantify how training affects device performance:
- Increased states (N_states) improve memory capacity.
- High skew (61%) and noise (90%) may limit reliability.
- **Trade-offs**: Optimizing for one metric (e.g., N_states) may degrade others (e.g., NSR).
---
**Note**: All values are approximate, derived from visual inspection of axis scales and legend labels. Uncertainties (e.g., ±σ) are inferred from shaded regions and histogram spreads.