## Line Chart: Accuracy vs. Number of Generated Solutions
### Overview
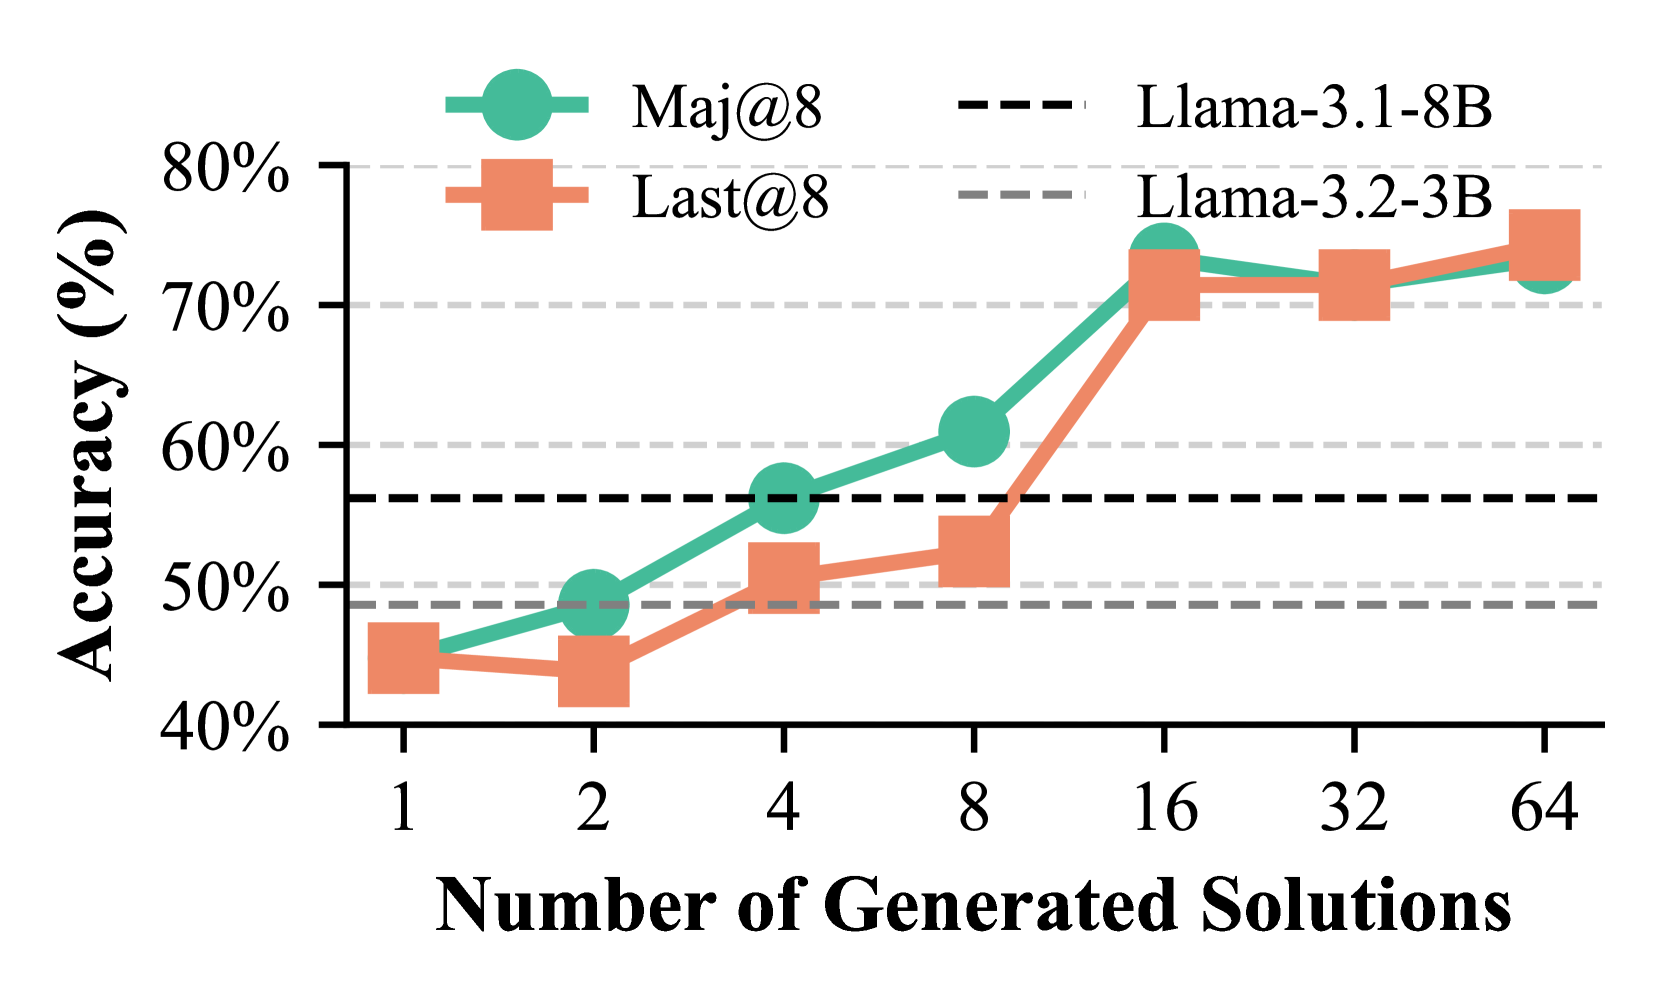
This line chart compares the accuracy of two language models, Llama-3.1-8B and Llama-3.2-3B, across two metrics (Maj@8 and Last@8) as the number of generated solutions increases. Accuracy is measured in percentage, and the number of generated solutions ranges from 1 to 64.
### Components/Axes
* **X-axis:** Number of Generated Solutions. Scale: 1, 2, 4, 8, 16, 32, 64.
* **Y-axis:** Accuracy (%). Scale: 40% to 80%.
* **Legend:** Located at the top-right of the chart.
* Maj@8 (Solid Green Line with Circle Markers)
* Last@8 (Solid Orange Line with Square Markers)
* Llama-3.1-8B (Dashed Black Line)
* Llama-3.2-3B (Dashed Gray Line)
* **Horizontal Lines:** Two dashed horizontal lines are present at 50% and 60% accuracy.
### Detailed Analysis
**Maj@8 (Green Line):**
The green line representing Maj@8 starts at approximately 43% accuracy at 1 generated solution. It shows a generally upward trend, with a steeper increase between 4 and 8 generated solutions, reaching approximately 68% at 8 solutions. The line continues to rise, reaching around 72% at 16 solutions, and plateaus around 72-73% for 32 and 64 solutions.
* 1 Solution: ~43%
* 2 Solutions: ~47%
* 4 Solutions: ~53%
* 8 Solutions: ~68%
* 16 Solutions: ~72%
* 32 Solutions: ~72%
* 64 Solutions: ~73%
**Last@8 (Orange Line):**
The orange line representing Last@8 begins at approximately 45% accuracy at 1 generated solution. It fluctuates slightly, reaching around 47% at 2 solutions, then dips to approximately 44% at 4 solutions. It then increases to around 50% at 8 solutions, and continues to rise, reaching approximately 68% at 32 and 64 solutions.
* 1 Solution: ~45%
* 2 Solutions: ~47%
* 4 Solutions: ~44%
* 8 Solutions: ~50%
* 16 Solutions: ~58%
* 32 Solutions: ~68%
* 64 Solutions: ~68%
**Llama-3.1-8B (Black Dashed Line):**
The black dashed line representing Llama-3.1-8B starts at approximately 58% accuracy at 1 generated solution. It remains relatively stable, fluctuating around 58-60% across all values of generated solutions (1 to 64).
* 1 Solution: ~58%
* 2 Solutions: ~59%
* 4 Solutions: ~59%
* 8 Solutions: ~60%
* 16 Solutions: ~60%
* 32 Solutions: ~60%
* 64 Solutions: ~60%
**Llama-3.2-3B (Gray Dashed Line):**
The gray dashed line representing Llama-3.2-3B starts at approximately 48% accuracy at 1 generated solution. It shows a slight upward trend, reaching around 52% at 2 solutions, and then plateaus around 52-54% for all other values of generated solutions (4 to 64).
* 1 Solution: ~48%
* 2 Solutions: ~52%
* 4 Solutions: ~53%
* 8 Solutions: ~53%
* 16 Solutions: ~54%
* 32 Solutions: ~54%
* 64 Solutions: ~54%
### Key Observations
* Maj@8 shows the most significant improvement in accuracy as the number of generated solutions increases, particularly between 4 and 16 solutions.
* Last@8 shows a more gradual increase in accuracy.
* Llama-3.1-8B consistently outperforms Llama-3.2-3B across all numbers of generated solutions.
* Both Llama models show relatively stable accuracy beyond 16 generated solutions.
* The 60% accuracy threshold is surpassed by Llama-3.1-8B and approached by Last@8 at higher solution counts.
### Interpretation
The data suggests that increasing the number of generated solutions improves the accuracy of both metrics (Maj@8 and Last@8), but the effect is more pronounced for Maj@8. This indicates that generating more solutions allows the model to explore a wider range of possibilities and potentially identify better solutions. The consistent outperformance of Llama-3.1-8B suggests that it is a more capable model than Llama-3.2-3B, at least for this specific task and evaluation metrics. The plateauing of accuracy at higher solution counts suggests that there is a diminishing return to generating more solutions beyond a certain point. The horizontal lines at 50% and 60% serve as benchmarks, highlighting the performance improvements achieved by the models as the number of generated solutions increases. The difference between Maj@8 and Last@8 could indicate that the model is better at identifying the *best* solution among many (Maj@8) than at consistently placing the best solution *last* in the generated list (Last@8).