\n
## Line Chart: Accuracy vs. Number of Generated Solutions for Llama Models
### Overview
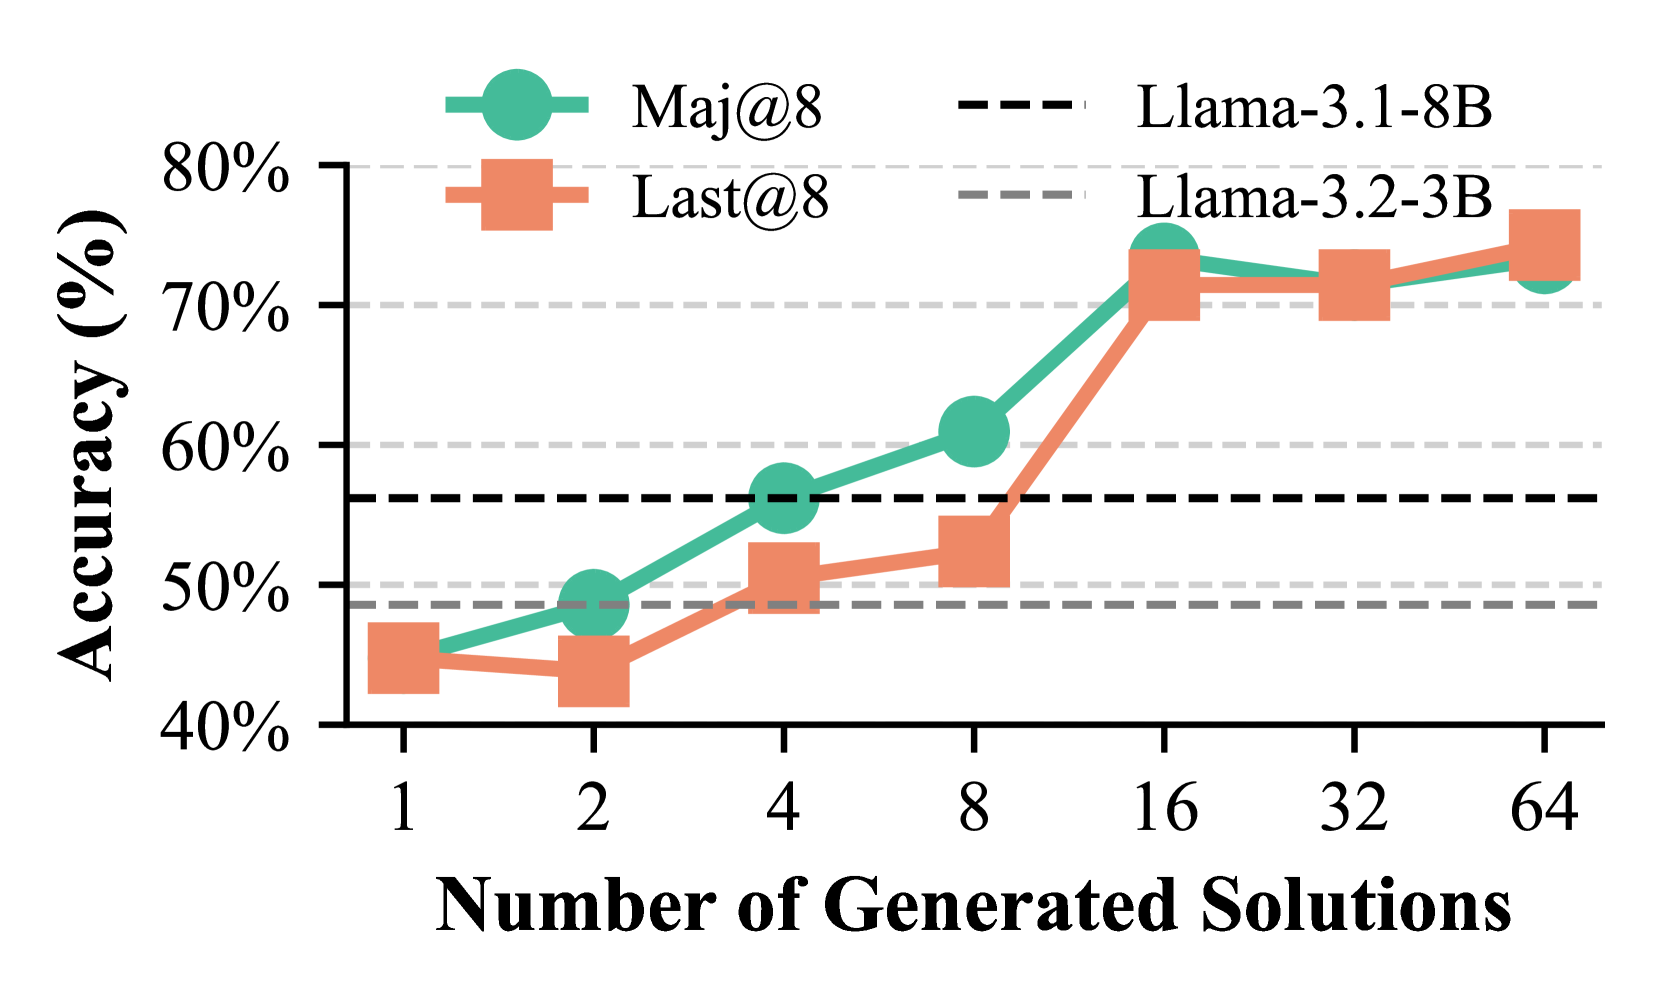
This image is a line chart comparing the performance of two evaluation methods ("Maj@8" and "Last@8") across two different Llama model sizes (3.1-8B and 3.2-3B) as the number of generated solutions increases. The chart demonstrates how accuracy scales with increased solution generation.
### Components/Axes
* **X-Axis:** Labeled "Number of Generated Solutions". It uses a logarithmic scale with discrete markers at 1, 2, 4, 8, 16, 32, and 64.
* **Y-Axis:** Labeled "Accuracy (%)". It is a linear scale ranging from 40% to 80%, with major gridlines at 10% intervals (40%, 50%, 60%, 70%, 80%).
* **Legend (Top Center):**
* **Left Column (Methods):**
* A teal circle icon labeled "Maj@8".
* An orange square icon labeled "Last@8".
* **Right Column (Model Baselines):**
* A black dashed line labeled "Llama-3.1-8B".
* A gray dashed line labeled "Llama-3.2-3B".
* **Data Series:**
1. **Maj@8 (Teal line with circle markers):** Represents the accuracy of the "Majority@8" method.
2. **Last@8 (Orange line with square markers):** Represents the accuracy of the "Last@8" method.
* **Baseline Reference Lines:**
* **Llama-3.1-8B (Black dashed line):** A horizontal line at approximately 56% accuracy.
* **Llama-3.2-3B (Gray dashed line):** A horizontal line at approximately 49% accuracy.
### Detailed Analysis
**Data Points (Approximate Values):**
| Number of Solutions | Maj@8 Accuracy (%) | Last@8 Accuracy (%) |
| :----------------- | :----------------- | :------------------ |
| 1 | ~45% | ~45% |
| 2 | ~49% | ~44% |
| 4 | ~56% | ~51% |
| 8 | ~61% | ~53% |
| 16 | ~74% | ~72% |
| 32 | ~72% | ~72% |
| 64 | ~73% | ~75% |
**Trend Verification:**
* **Maj@8 (Teal Line):** Shows a consistent upward trend from 1 to 16 solutions, with a steep increase between 8 and 16. It plateaus between 16 and 64 solutions, hovering in the low-to-mid 70% range.
* **Last@8 (Orange Line):** Shows a more gradual upward trend from 1 to 8 solutions. It experiences a very sharp increase between 8 and 16 solutions, converging with the Maj@8 line. From 16 to 64 solutions, it remains stable in the low-to-mid 70% range, ending slightly higher than Maj@8 at 64 solutions.
### Key Observations
1. **Performance Scaling:** Both methods show significant accuracy gains as the number of generated solutions increases from 1 to 16.
2. **Critical Threshold:** The most dramatic improvement for both methods occurs when increasing from 8 to 16 generated solutions.
3. **Method Comparison:** "Maj@8" outperforms "Last@8" at lower solution counts (2, 4, 8). Their performance converges at 16 solutions and remains very similar thereafter.
4. **Surpassing Baselines:** Both methods surpass the Llama-3.1-8B baseline (~56%) at 8 solutions (Maj@8) or 16 solutions (Last@8). They significantly exceed the Llama-3.2-3B baseline (~49%) from 4 solutions onward.
5. **Plateau Effect:** After 16 solutions, generating more solutions (32, 64) yields minimal additional accuracy improvement for either method, suggesting diminishing returns.
### Interpretation
The data suggests that generating multiple solutions and applying a selection strategy (either majority vote or taking the last one) is highly effective for improving the accuracy of these language models on the evaluated task. The "Maj@8" method appears more sample-efficient, achieving higher accuracy with fewer generated solutions. However, with a sufficient number of solutions (16 or more), the simpler "Last@8" method performs comparably.
The sharp performance jump at 16 solutions indicates a potential phase change or threshold where the model's output distribution becomes rich enough for the selection mechanisms to work very effectively. The plateau after 16 solutions implies that the core capability of the model is being fully leveraged by these methods, and further gains would likely require improvements to the base model itself rather than just more sampling.
The chart effectively argues for the utility of inference-time computation (generating more solutions) as a powerful tool to boost performance, with the choice between "Maj@8" and "Last@8" potentially depending on the computational budget (fewer solutions favor Maj@8) or implementation simplicity (Last@8).