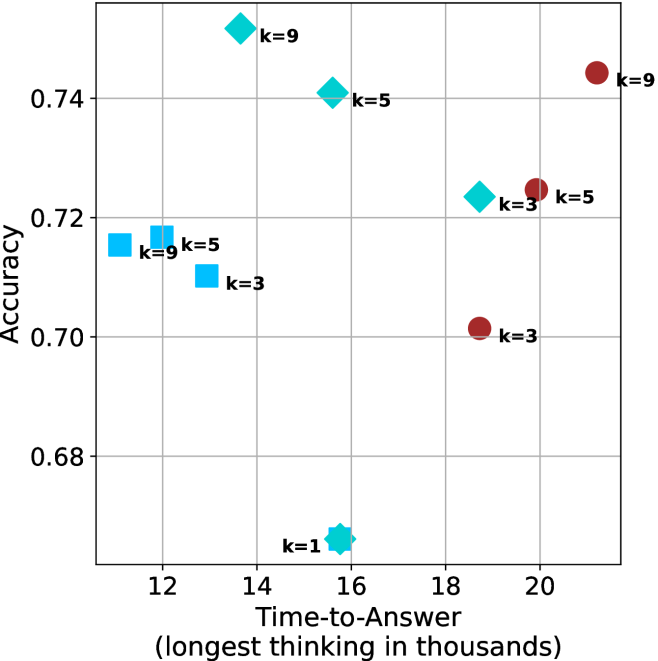
## Scatter Plot: Accuracy vs. Time-to-Answer (Longest Thinking in Thousands)
### Overview
The image is a scatter plot comparing **accuracy** (y-axis) and **time-to-answer** (x-axis, in thousands of units). Data points are color-coded by the parameter `k` (1, 3, 5, 9), with distinct markers for each `k` value. The plot highlights trade-offs between computational effort (time) and performance (accuracy).
---
### Components/Axes
- **Y-axis (Accuracy)**: Ranges from 0.68 to 0.74, with gridlines at 0.68, 0.70, 0.72, 0.74.
- **X-axis (Time-to-Answer)**: Ranges from 12 to 20 (in thousands), with gridlines at 12, 14, 16, 18, 20.
- **Legend**: Located on the right, mapping:
- **Blue squares**: `k=3`
- **Cyan diamonds**: `k=5`
- **Red circles**: `k=9`
- **Star symbol**: `k=1`
- **Markers**: Each `k` value uses a unique symbol (e.g., `k=1` is a star, `k=3` is a square).
---
### Detailed Analysis
#### Data Points by `k`:
1. **`k=1` (Star)**:
- Single point at (15, 0.69).
- Lowest accuracy and moderate time-to-answer.
2. **`k=3` (Blue Square)**:
- Points at:
- (12, 0.71)
- (13, 0.71)
- (17, 0.70)
- (20, 0.70)
- Consistent accuracy (~0.70–0.71) with increasing time-to-answer.
3. **`k=5` (Cyan Diamond)**:
- Points at:
- (12, 0.71)
- (13, 0.71)
- (16, 0.74)
- (17, 0.72)
- Highest accuracy (0.74) at time=16, with a slight drop at time=17.
4. **`k=9` (Red Circle)**:
- Points at:
- (14, 0.74)
- (16, 0.74)
- (20, 0.74)
- Perfect accuracy (0.74) across all time-to-answer values.
---
### Key Observations
1. **`k=9` Dominates Accuracy**:
- Maintains 0.74 accuracy regardless of time-to-answer, suggesting optimal performance at higher computational cost.
2. **`k=5` Shows Trade-off**:
- Peaks at 0.74 accuracy at time=16 but drops to 0.72 at time=17, indicating sensitivity to time.
3. **`k=3` and `k=1` Underperform**:
- `k=3` achieves ~0.70–0.71 accuracy, while `k=1` lags at 0.69.
4. **Time-Accuracy Correlation**:
- Higher `k` values (e.g., 9) achieve better accuracy but require longer processing time.
---
### Interpretation
- **Computational Trade-off**: Increasing `k` improves accuracy but increases time-to-answer. For example, `k=9` achieves perfect accuracy but requires the longest processing time (20k units).
- **Optimal `k` for Balance**: `k=5` offers a middle ground, achieving high accuracy (0.74) at moderate time (16k units), though it is less stable than `k=9`.
- **Outliers**: `k=1` is an outlier with the lowest accuracy and moderate time, suggesting inefficiency at low computational effort.
- **Stability of `k=9`**: Its consistent accuracy across all time points implies robustness, possibly due to exhaustive computation.
This plot underscores the relationship between model complexity (`k`) and performance, highlighting the need to balance accuracy and computational resources.