## Scatter Plot: Accuracy vs. Time-to-Answer
### Overview
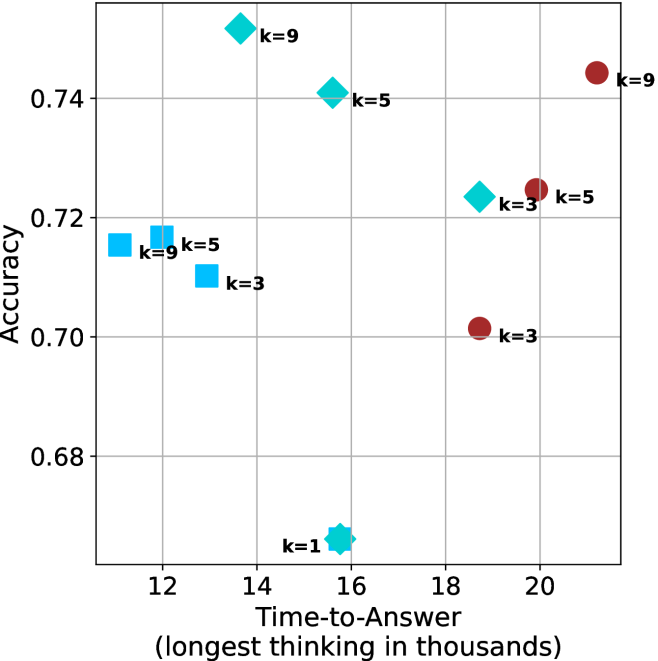
The image is a scatter plot visualizing the relationship between computational cost ("Time-to-Answer") and model performance ("Accuracy"). The plot uses distinct shapes and colors to categorize data points, likely representing different model architectures or inference configurations, labeled with a "k" parameter (ranging from k=1 to k=9).
### Components/Axes
* **Y-Axis:** "Accuracy". The scale ranges from 0.68 to 0.74, with grid lines at 0.02 intervals.
* **X-Axis:** "Time-to-Answer (longest thinking in thousands)". The scale ranges from 12 to 20, with grid lines at 2-unit intervals.
* **Data Series (Categorized by Shape/Color):**
* **Cyan Squares:** Located in the left-center region.
* **Cyan Diamonds:** Located in the upper-middle region.
* **Cyan Star:** Located at the bottom-center.
* **Maroon Circles:** Located in the right-center region.
* **Labels:** Each data point is annotated with a "k=" value (k=1, k=3, k=5, k=9), indicating a specific configuration parameter.
### Detailed Analysis
The data points are clustered into four distinct groups based on shape and color. Below are the approximate coordinates (x, y) for each point:
**1. Cyan Squares (Left Cluster)**
* **k=9:** Positioned at x ≈ 11.2, y ≈ 0.715.
* **k=5:** Positioned at x ≈ 11.8, y ≈ 0.717.
* **k=3:** Positioned at x ≈ 12.5, y ≈ 0.710.
* *Trend:* This group shows a slight increase in accuracy from k=9 to k=5, followed by a decrease at k=3, while time-to-answer consistently increases as k decreases.
**2. Cyan Diamonds (Upper-Middle Cluster)**
* **k=9:** Positioned at x ≈ 13.2, y ≈ 0.752.
* **k=5:** Positioned at x ≈ 15.5, y ≈ 0.741.
* **k=3:** Positioned at x ≈ 18.8, y ≈ 0.724.
* *Trend:* There is a strong positive correlation between the "k" value and accuracy. As "k" decreases (9 → 5 → 3), accuracy drops significantly (0.752 → 0.724), and time-to-answer increases significantly (13.2 → 18.8).
**3. Cyan Star (Bottom-Center)**
* **k=1:** Positioned at x ≈ 15.8, y ≈ 0.668.
* *Trend:* This is a singular data point representing the lowest accuracy on the entire chart.
**4. Maroon Circles (Right Cluster)**
* **k=9:** Positioned at x ≈ 21.2, y ≈ 0.745.
* **k=5:** Positioned at x ≈ 19.8, y ≈ 0.725.
* **k=3:** Positioned at x ≈ 18.8, y ≈ 0.702.
* *Trend:* Similar to the Cyan Diamonds, there is a positive correlation between "k" and accuracy. As "k" decreases (9 → 5 → 3), both accuracy and time-to-answer decrease.
### Key Observations
* **Efficiency Leader:** The Cyan Diamond configuration at k=9 achieves the highest accuracy (≈ 0.752) while maintaining a relatively low time-to-answer (≈ 13.2).
* **Performance Trade-off:** For both the Cyan Diamonds and Maroon Circles, higher "k" values consistently yield higher accuracy.
* **Outlier:** The Cyan Star (k=1) is a significant outlier, demonstrating the lowest accuracy despite having a moderate time-to-answer cost.
* **Group Separation:** The Maroon Circles generally occupy the highest time-to-answer range (18.8 to 21.2), making them the most computationally expensive group.
### Interpretation
This chart likely benchmarks Large Language Model (LLM) inference strategies, where "k" represents a parameter such as the number of reasoning steps, beam search width, or the number of samples generated (e.g., "best-of-k").
* **The "k" Factor:** The data demonstrates that increasing "k" is generally beneficial for accuracy, but the efficiency of this gain varies by model type (represented by the different shapes/colors).
* **Diminishing Returns:** The Cyan Diamonds represent the most efficient strategy, achieving high accuracy with lower latency. The Maroon Circles, while achieving high accuracy at k=9, require significantly more time to compute.
* **Strategic Choice:** If a user requires high accuracy, the Cyan Diamond (k=9) is the optimal choice. If a user is constrained by time, the Cyan Squares offer a "fast" but lower-accuracy alternative. The Maroon group appears to be a less efficient architecture compared to the Cyan Diamonds, as it requires more time to achieve similar or lower accuracy levels.