\n
## Diagram: Variational Autoencoder (VAE) Architecture
### Overview
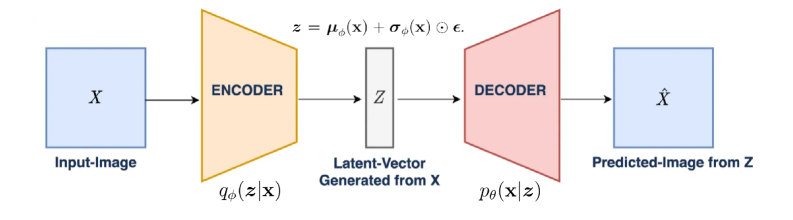
The image depicts the architecture of a Variational Autoencoder (VAE), a type of generative model used in machine learning. It illustrates the flow of data through an encoder, a latent space, and a decoder. The diagram shows how an input image 'X' is transformed into a latent vector 'Z', and then reconstructed into a predicted image 'X̂'.
### Components/Axes
The diagram consists of the following components:
* **Input-Image (X):** Represented by a light blue square, labeled "Input-Image" below it.
* **Encoder:** Represented by a light orange trapezoid, labeled "ENCODER" above it. An arrow indicates the flow of data from the Input-Image to the Encoder.
* **Latent-Vector Generated from X (Z):** Represented by a gray rectangle, labeled "Latent-Vector Generated from X" above it. An arrow indicates the flow of data from the Encoder to the Latent-Vector.
* **Decoder:** Represented by a light red trapezoid, labeled "DECODER" above it. An arrow indicates the flow of data from the Latent-Vector to the Decoder.
* **Predicted-Image from Z (X̂):** Represented by a light blue square, labeled "Predicted-Image from Z" below it. An arrow indicates the flow of data from the Decoder to the Predicted-Image.
* **Mathematical Equation:** `z = μσ(X) + σσ(X) ⊙ ε.` positioned above the Latent-Vector.
* **Probabilistic Notation:** `qΦ(z|x)` positioned below the Encoder.
* **Probabilistic Notation:** `pθ(x|z)` positioned below the Decoder.
### Detailed Analysis / Content Details
The diagram illustrates a process where an input image 'X' is passed through an encoder. The encoder transforms 'X' into a latent vector 'Z'. The latent vector is generated using the equation `z = μσ(X) + σσ(X) ⊙ ε.`. This equation suggests that 'Z' is a function of 'X' involving mean (μ), standard deviation (σ), and a random variable (ε). The latent vector 'Z' is then passed through a decoder, which reconstructs the image into a predicted image 'X̂'.
The probabilistic notations `qΦ(z|x)` and `pθ(x|z)` indicate that the encoder and decoder are probabilistic models parameterized by Φ and θ, respectively. `qΦ(z|x)` represents the approximate posterior distribution of the latent variable 'z' given the input 'x', and `pθ(x|z)` represents the generative distribution of the input 'x' given the latent variable 'z'.
### Key Observations
The diagram highlights the key components of a VAE: encoding, latent representation, and decoding. The use of probabilistic notation suggests that the VAE learns a distribution over the latent space, allowing it to generate new samples similar to the training data. The flow of data is clearly indicated by the arrows, showing a sequential process.
### Interpretation
The diagram represents a simplified view of a VAE, a powerful generative model. The VAE aims to learn a compressed, latent representation of the input data (X) and then reconstruct it (X̂). The probabilistic nature of the model allows for generating new data points by sampling from the latent space. The equation and notations suggest a Bayesian approach to learning the latent representation. The VAE is used for tasks like image generation, dimensionality reduction, and anomaly detection. The diagram effectively communicates the core concept of encoding data into a lower-dimensional latent space and then decoding it back to its original form.