## Line Graph: GPQA vs. RL Training Steps
### Overview
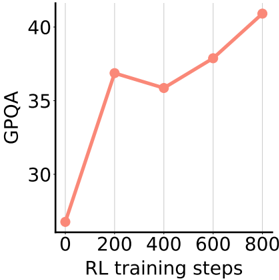
The image depicts a line graph illustrating the relationship between GPQA (General Purpose Question Answering) performance and RL (Reinforcement Learning) training steps. The graph shows a generally upward trend with fluctuations, starting at approximately 25 GPQA at 0 training steps and reaching ~41 GPQA at 800 steps.
### Components/Axes
- **Y-Axis (Left)**: Labeled "GPQA" with a scale from 30 to 40 in increments of 5.
- **X-Axis (Bottom)**: Labeled "RL training steps" with markers at 0, 200, 400, 600, and 800.
- **Grid Lines**: Vertical and horizontal grid lines at 200-step intervals and GPQA increments of 5.
- **Data Line**: A single red line with circular data points (red dots) at each training step marker.
- **Legend**: No explicit legend is present in the image.
### Detailed Analysis
- **Data Points**:
- **0 steps**: ~25 GPQA (lowest point).
- **200 steps**: ~37 GPQA (first peak).
- **400 steps**: ~36 GPQA (slight dip).
- **600 steps**: ~38 GPQA (moderate increase).
- **800 steps**: ~41 GPQA (highest point).
- **Line Behavior**:
- The line starts at the bottom-left corner (0, 25) and ascends sharply to 37 at 200 steps.
- A minor decline occurs between 200 and 400 steps, followed by a gradual rise to 38 at 600 steps.
- A steep upward trajectory dominates the final segment, reaching 41 at 800 steps.
### Key Observations
1. **Initial Rapid Improvement**: The steepest increase occurs between 0 and 200 steps, suggesting early training efficiency.
2. **Plateau and Dip**: A slight decline at 400 steps may indicate a temporary setback or optimization challenge.
3. **Final Surge**: The sharp rise after 600 steps implies accelerated progress, potentially due to model refinement or data saturation.
4. **Consistency**: Despite fluctuations, the overall trend is upward, indicating a positive correlation between training steps and GPQA performance.
### Interpretation
The graph demonstrates that RL training steps significantly impact GPQA performance, with the most substantial gains occurring in the final phase. The initial dip at 400 steps could reflect challenges in balancing exploration and exploitation during training. The final surge suggests that extended training leads to breakthroughs, possibly due to improved policy optimization or data utilization. The absence of a legend simplifies interpretation but limits contextual understanding of multiple metrics. The grid lines enhance readability, emphasizing the stepwise progression of training.