\n
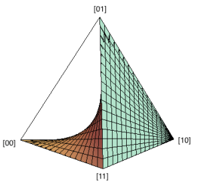
## 3D Surface Plot: Triangular Surface
### Overview
The image depicts a 3D surface plot resembling a saddle or hyperbolic paraboloid, constrained within a triangular region. The surface is rendered as a grid of intersecting lines, with color differentiation indicating varying z-values. The plot is oriented such that the apex of the triangle points upwards.
### Components/Axes
The plot is defined by three axes, labeled as follows:
* **X-axis:** [0] to [10] - Located at the bottom-left corner of the triangular base.
* **Y-axis:** [0] to [11] - Located at the bottom-right corner of the triangular base.
* **Z-axis:** [0] to [11] - Located at the apex of the triangle.
The surface itself is the primary component, displaying a curved shape. The grid lines represent constant values along the x and y axes. The surface is colored with a gradient, transitioning from a brownish-orange hue to a light green.
### Detailed Analysis or Content Details
The surface exhibits a saddle-like shape. Starting from the x-axis ([0] to [10]), the surface initially descends, reaching a minimum value around x = 5, y = 5. Then, it rises again towards the y-axis ([0] to [11]). The z-values appear to be negative in the region near x = 5 and y = 5, and positive elsewhere.
The grid lines are approximately evenly spaced. The surface is relatively smooth, with no sharp discontinuities visible.
* **X = 0:** Z values range from approximately 0 to 11.
* **X = 10:** Z values range from approximately 0 to 11.
* **Y = 0:** Z values range from approximately 0 to 11.
* **Y = 11:** Z values range from approximately 0 to 11.
* **Minimum Z value:** Approximately -1 to -2, located around x = 5, y = 5.
* **Maximum Z value:** Approximately 11, located along the edges of the triangle.
### Key Observations
The most notable feature is the saddle shape, indicating a hyperbolic paraboloid function. The minimum z-value is located near the center of the triangular base. The surface is symmetrical along both the x and y axes.
### Interpretation
This plot likely represents a visualization of a mathematical function of two variables, z = f(x, y). The hyperbolic paraboloid shape suggests a function with a saddle point. The triangular domain indicates that the function is only defined within this specific region. The color gradient provides a visual representation of the z-values, allowing for a quick understanding of the function's behavior. The plot demonstrates a function that changes sign within its domain, having both positive and negative z-values. The function is likely defined as something like z = x*y, or a similar quadratic form. The plot is a visual aid for understanding the function's characteristics, such as its saddle point, symmetry, and range of values.