\n
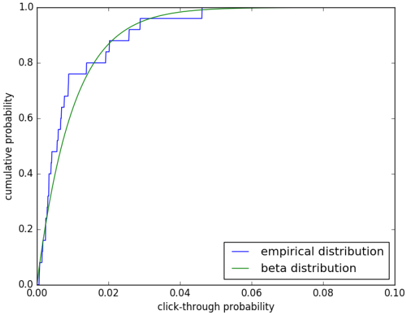
## Chart: Cumulative Distribution of Click-Through Probability
### Overview
The image presents a chart comparing the empirical distribution of click-through probability with a beta distribution. The chart displays cumulative probability on the y-axis against click-through probability on the x-axis. Two lines are plotted, representing the two distributions.
### Components/Axes
* **X-axis Title:** "click-through probability"
* Scale: 0.00 to 0.10, with markers at 0.02, 0.04, 0.06, 0.08.
* **Y-axis Title:** "cumulative probability"
* Scale: 0.00 to 1.00, with markers at 0.2, 0.4, 0.6, 0.8.
* **Legend:** Located in the bottom-right corner.
* "empirical distribution" - Blue line
* "beta distribution" - Green line
### Detailed Analysis
* **Empirical Distribution (Blue Line):** The line starts at approximately (0.00, 0.00) and rises rapidly.
* At click-through probability of 0.00, cumulative probability is approximately 0.00.
* At click-through probability of 0.02, cumulative probability is approximately 0.35.
* At click-through probability of 0.04, cumulative probability is approximately 0.65.
* At click-through probability of 0.06, cumulative probability is approximately 0.80.
* At click-through probability of 0.08, cumulative probability is approximately 0.90.
* At click-through probability of 0.10, cumulative probability is approximately 0.98.
* **Beta Distribution (Green Line):** The line also starts at approximately (0.00, 0.00) and rises, but with a slightly different curve.
* At click-through probability of 0.00, cumulative probability is approximately 0.00.
* At click-through probability of 0.02, cumulative probability is approximately 0.40.
* At click-through probability of 0.04, cumulative probability is approximately 0.70.
* At click-through probability of 0.06, cumulative probability is approximately 0.85.
* At click-through probability of 0.08, cumulative probability is approximately 0.95.
* At click-through probability of 0.10, cumulative probability is approximately 1.00.
### Key Observations
The empirical distribution and the beta distribution are very similar, especially at higher click-through probabilities. The beta distribution appears to slightly overestimate the cumulative probability at lower click-through probabilities (between 0.00 and 0.04) and slightly underestimate it at higher probabilities (between 0.06 and 0.10). Both distributions approach a cumulative probability of 1.0 as the click-through probability approaches 0.10.
### Interpretation
This chart demonstrates how well a beta distribution approximates the empirical distribution of click-through probabilities. The close alignment between the two curves suggests that the beta distribution is a reasonable model for the observed click-through data. The slight discrepancies could indicate that the parameters of the beta distribution are not perfectly tuned to the empirical data, or that the empirical data deviates slightly from a true beta distribution. This type of analysis is common in A/B testing and statistical modeling to understand user behavior and predict future outcomes. The chart suggests that the beta distribution provides a good fit for modeling click-through probabilities, which can be used for tasks like estimating confidence intervals or making predictions about future click-through rates.