## Vector Diagram: Vector Relationships
### Overview
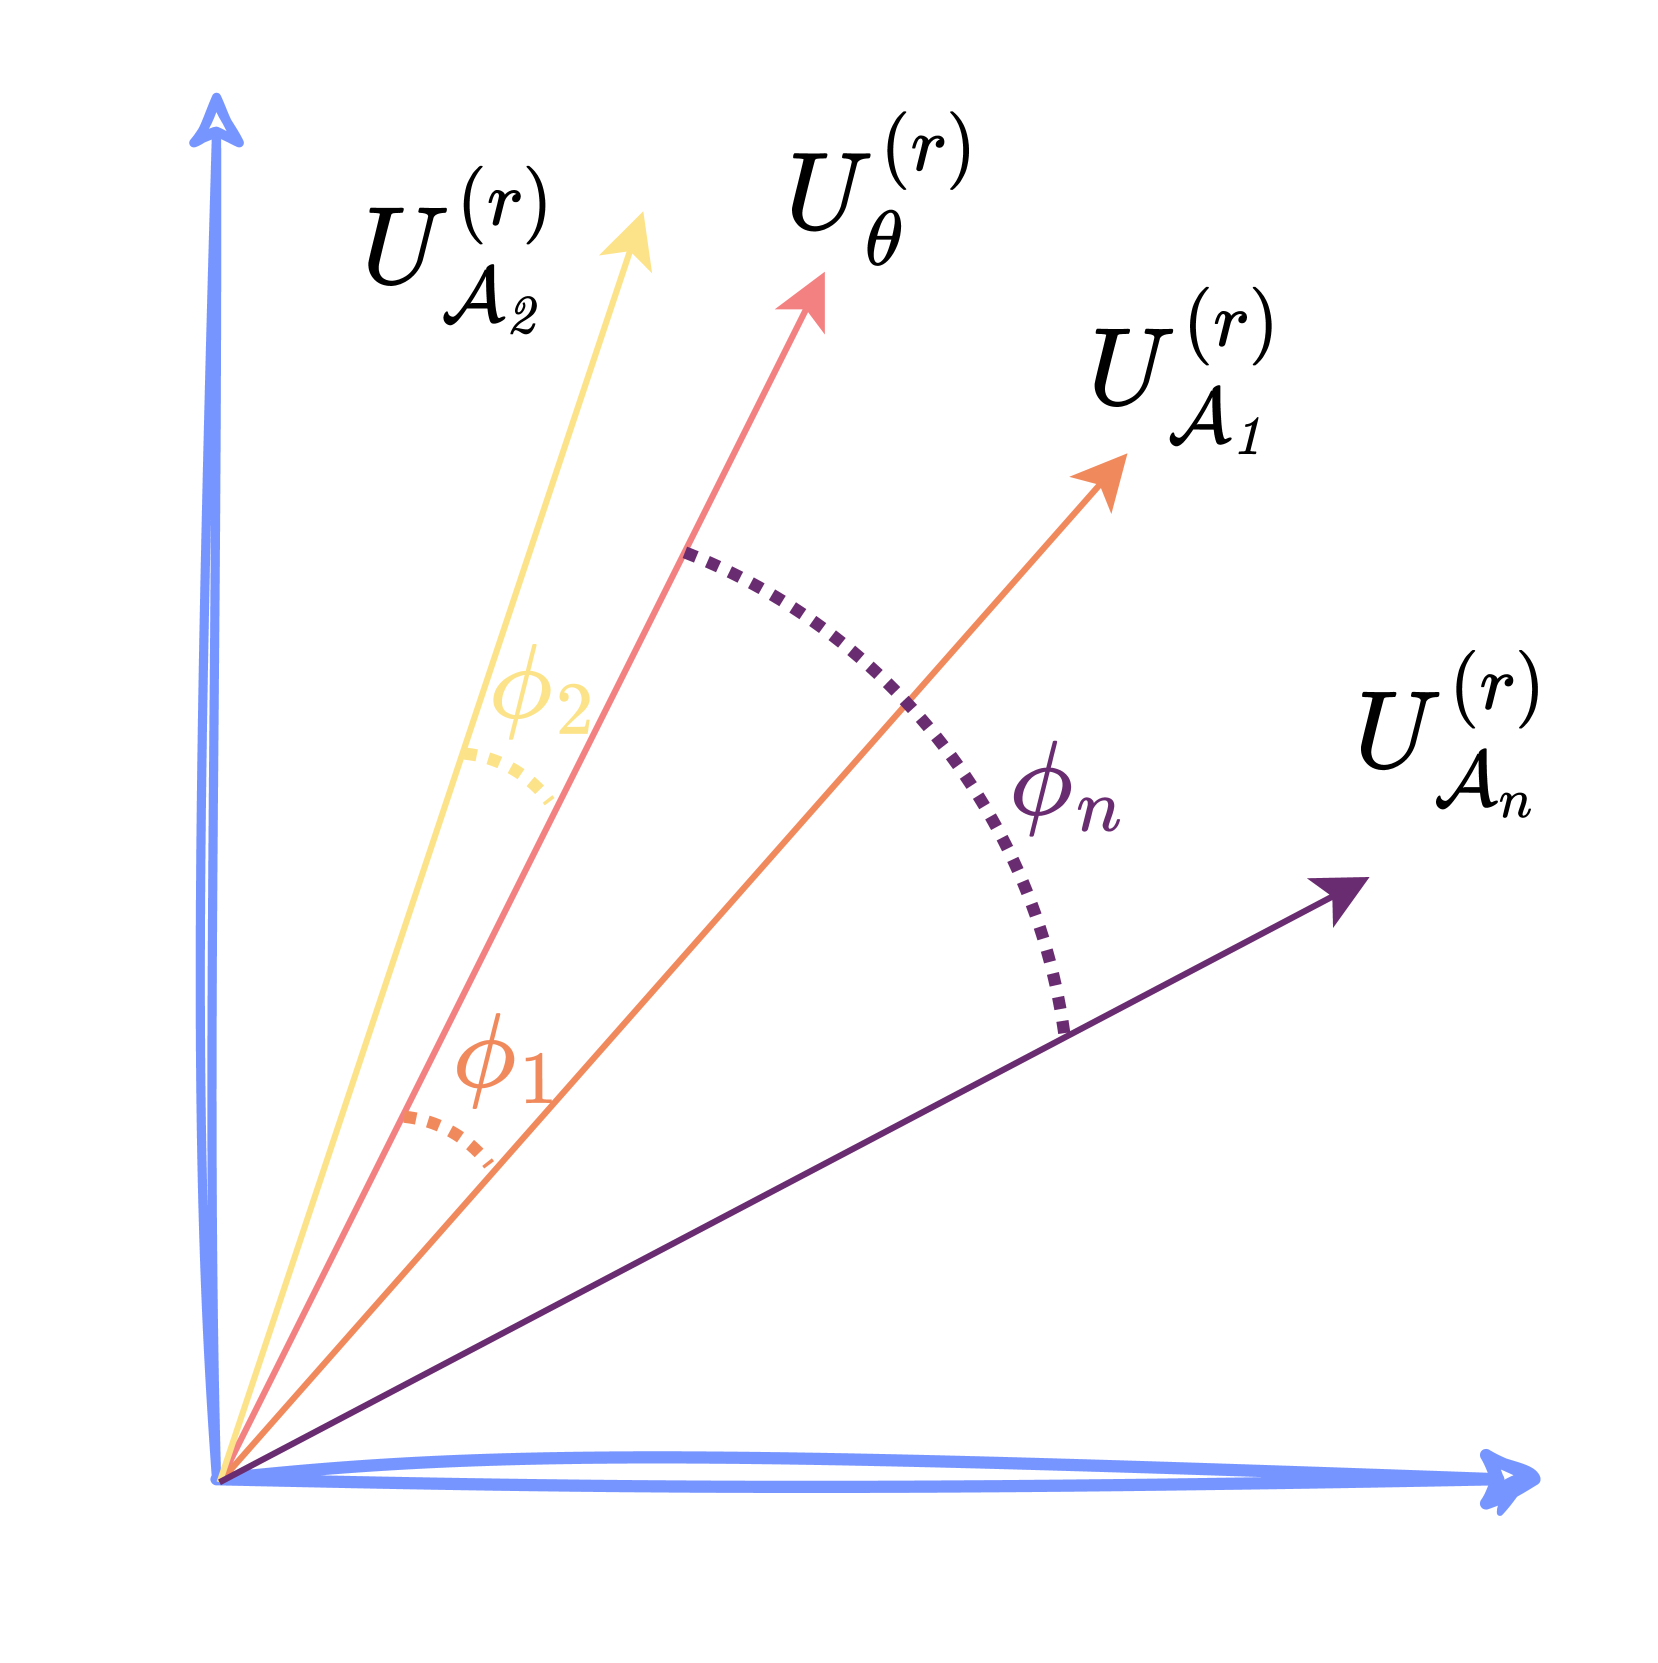
The image is a vector diagram illustrating the relationships between several vectors. It shows the relative angles and orientations of the vectors in a two-dimensional space.
### Components/Axes
* **Axes:** The diagram has two axes, a vertical axis and a horizontal axis, both in light blue. The origin is at the intersection of the axes.
* **Vectors:** There are four vectors labeled as follows:
* $U_{A_2}^{(r)}$ (light yellow)
* $U_{\theta}^{(r)}$ (light red/pink)
* $U_{A_1}^{(r)}$ (light orange)
* $U_{A_n}^{(r)}$ (purple)
* **Angles:** The diagram also shows angles between the vectors:
* $\phi_2$ (light yellow, dotted arc) - Angle between the vertical axis and $U_{A_2}^{(r)}$
* $\phi_1$ (light orange, dotted arc) - Angle between $U_{A_2}^{(r)}$ and $U_{\theta}^{(r)}$
* $\phi_n$ (purple, dotted arc) - Angle between $U_{\theta}^{(r)}$ and $U_{A_1}^{(r)}$
### Detailed Analysis
* **Vector $U_{A_2}^{(r)}$:** This vector is light yellow and is positioned at an angle $\phi_2$ relative to the vertical axis.
* **Vector $U_{\theta}^{(r)}$:** This vector is light red/pink and is positioned at an angle $\phi_1$ relative to the vector $U_{A_2}^{(r)}$.
* **Vector $U_{A_1}^{(r)}$:** This vector is light orange and is positioned at an angle $\phi_n$ relative to the vector $U_{\theta}^{(r)}$.
* **Vector $U_{A_n}^{(r)}$:** This vector is purple and is positioned at an angle relative to the vector $U_{A_1}^{(r)}$.
* **Angles:** The angles $\phi_2$, $\phi_1$, and $\phi_n$ are represented by dotted arcs.
### Key Observations
* The vectors are arranged in a counter-clockwise direction starting from the vertical axis.
* The angles between the vectors are explicitly labeled.
* The diagram provides a visual representation of the angular relationships between the vectors.
### Interpretation
The diagram illustrates the angular relationships between a set of vectors. The vectors $U_{A_2}^{(r)}$, $U_{\theta}^{(r)}$, $U_{A_1}^{(r)}$, and $U_{A_n}^{(r)}$ are positioned at different angles relative to each other and the vertical axis. The angles $\phi_2$, $\phi_1$, and $\phi_n$ quantify these angular relationships. The diagram could be used to represent the orientation of different components in a system or the phase relationships between different signals. The specific meaning depends on the context in which this diagram is used.