## Charts: Current vs. Voltage, Pulse Width, and Time
### Overview
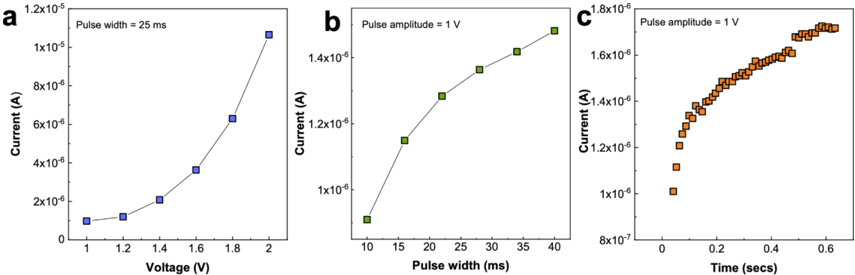
The image presents three separate charts (a, b, and c) illustrating the relationship between current and other parameters. Chart (a) shows current as a function of voltage, (b) shows current as a function of pulse width, and (c) shows current as a function of time. All charts appear to represent experimental data.
### Components/Axes
* **Chart a:**
* X-axis: Voltage (V), ranging from approximately 1.15V to 2.0V.
* Y-axis: Current (A), ranging from 0A to 1.2 x 10^-5 A.
* Title: "Pulse width = 25 ms"
* Data Series: Single series represented by blue squares.
* **Chart b:**
* X-axis: Pulse width (ms), ranging from approximately 10ms to 40ms.
* Y-axis: Current (A), ranging from approximately 2 x 10^-6 A to 1.5 x 10^-5 A.
* Title: "Pulse amplitude = 1 V"
* Data Series: Single series represented by green squares.
* **Chart c:**
* X-axis: Time (secs), ranging from approximately 0.05s to 0.6s.
* Y-axis: Current (A), ranging from approximately 8 x 10^-7 A to 1.8 x 10^-5 A.
* Title: "Pulse amplitude = 1 V"
* Data Series: Single series represented by orange squares.
### Detailed Analysis or Content Details
* **Chart a:** The blue data series shows a strong positive correlation between voltage and current. The line slopes sharply upwards.
* (1.15V, 1.0 x 10^-6 A)
* (1.25V, 1.8 x 10^-6 A)
* (1.35V, 2.6 x 10^-6 A)
* (1.45V, 3.5 x 10^-6 A)
* (1.6V, 4.8 x 10^-6 A)
* (1.8V, 6.2 x 10^-6 A)
* (2.0V, 1.15 x 10^-5 A)
* **Chart b:** The green data series shows a positive correlation between pulse width and current. The line slopes upwards, but the increase in current appears to slow down at higher pulse widths.
* (10ms, 2.0 x 10^-6 A)
* (15ms, 4.0 x 10^-6 A)
* (20ms, 6.0 x 10^-6 A)
* (25ms, 8.0 x 10^-6 A)
* (30ms, 1.0 x 10^-5 A)
* (35ms, 1.2 x 10^-5 A)
* (40ms, 1.5 x 10^-5 A)
* **Chart c:** The orange data series shows a positive correlation between time and current. The line slopes upwards, but the increase in current appears to slow down at higher times.
* (0.05s, 8.0 x 10^-7 A)
* (0.1s, 1.5 x 10^-6 A)
* (0.2s, 4.0 x 10^-6 A)
* (0.3s, 8.0 x 10^-6 A)
* (0.4s, 1.2 x 10^-5 A)
* (0.5s, 1.5 x 10^-5 A)
* (0.6s, 1.75 x 10^-5 A)
### Key Observations
* All three charts demonstrate a positive relationship between the independent variable and current.
* The relationship between voltage and current (Chart a) appears to be the most linear.
* The relationships between pulse width/time and current (Charts b and c) show diminishing returns, suggesting a saturation effect.
### Interpretation
The data suggests that current increases with increasing voltage, pulse width, and time. The saturation observed in Charts b and c could indicate a limit to the current that can be induced by increasing pulse width or time, potentially due to the material's properties or the experimental setup. Chart a demonstrates a linear relationship, which is consistent with Ohm's Law (V = IR), suggesting a constant resistance within the measured voltage range. The different pulse amplitudes and widths used in the experiments (indicated in the chart titles) likely influence the current flow, and the data provides insights into how these parameters affect the system's response. The data could be used to characterize the electrical behavior of a material or device under pulsed conditions.