## Line Graphs: Llama-3.2-1B and Llama-3.2-3B Performance
### Overview
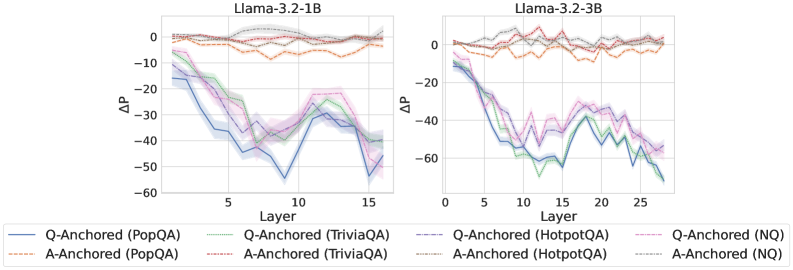
The image presents two line graphs comparing the performance of Llama-3.2-1B and Llama-3.2-3B models across different layers. The y-axis represents ΔP (change in performance), and the x-axis represents the layer number. Each graph contains six data series, representing different question-answering tasks (PopQA, TriviaQA, HotpotQA, and NQ) anchored by either the question (Q-Anchored) or the answer (A-Anchored).
### Components/Axes
* **Titles:**
* Left Graph: Llama-3.2-1B
* Right Graph: Llama-3.2-3B
* **Y-Axis:**
* Label: ΔP
* Scale: -60 to 0, with increments of 10 (-60, -50, -40, -30, -20, -10, 0)
* **X-Axis:**
* Label: Layer
* Left Graph Scale: 0 to 15, with increments of 5 (0, 5, 10, 15)
* Right Graph Scale: 0 to 25, with increments of 5 (0, 5, 10, 15, 20, 25)
* **Legend:** Located at the bottom of the image.
* Q-Anchored (PopQA): Solid Blue Line
* A-Anchored (PopQA): Dashed Orange Line
* Q-Anchored (TriviaQA): Dotted Green Line
* A-Anchored (TriviaQA): Dotted Brown Line
* Q-Anchored (HotpotQA): Dash-Dotted Blue Line
* A-Anchored (HotpotQA): Dash-Dotted Green Line
* Q-Anchored (NQ): Dash-Dotted Purple Line
* A-Anchored (NQ): Dotted Gray Line
### Detailed Analysis
**Left Graph: Llama-3.2-1B**
* **Q-Anchored (PopQA):** (Solid Blue Line) Starts at approximately -10 and generally decreases to around -55 by layer 10, then increases to approximately -40 by layer 15.
* **A-Anchored (PopQA):** (Dashed Orange Line) Remains relatively stable around -5 to -10 across all layers.
* **Q-Anchored (TriviaQA):** (Dotted Green Line) Starts at approximately -10 and decreases to around -35 by layer 10, then increases to approximately -25 by layer 15.
* **A-Anchored (TriviaQA):** (Dotted Brown Line) Remains relatively stable around -5 to -10 across all layers.
* **Q-Anchored (HotpotQA):** (Dash-Dotted Blue Line) Starts at approximately -10 and decreases to around -50 by layer 10, then increases to approximately -40 by layer 15.
* **A-Anchored (HotpotQA):** (Dash-Dotted Green Line) Starts at approximately -10 and decreases to around -35 by layer 10, then increases to approximately -25 by layer 15.
* **Q-Anchored (NQ):** (Dash-Dotted Purple Line) Starts at approximately -10 and decreases to around -35 by layer 10, then increases to approximately -20 by layer 15.
* **A-Anchored (NQ):** (Dotted Gray Line) Remains relatively stable around -5 to -10 across all layers.
**Right Graph: Llama-3.2-3B**
* **Q-Anchored (PopQA):** (Solid Blue Line) Starts at approximately -10 and generally decreases to around -65 by layer 15, then increases to approximately -50 by layer 25.
* **A-Anchored (PopQA):** (Dashed Orange Line) Remains relatively stable around -5 to -10 across all layers.
* **Q-Anchored (TriviaQA):** (Dotted Green Line) Starts at approximately -10 and decreases to around -65 by layer 15, then increases to approximately -50 by layer 25.
* **A-Anchored (TriviaQA):** (Dotted Brown Line) Remains relatively stable around -5 to -10 across all layers.
* **Q-Anchored (HotpotQA):** (Dash-Dotted Blue Line) Starts at approximately -10 and decreases to around -65 by layer 15, then increases to approximately -50 by layer 25.
* **A-Anchored (HotpotQA):** (Dash-Dotted Green Line) Starts at approximately -10 and decreases to around -65 by layer 15, then increases to approximately -50 by layer 25.
* **Q-Anchored (NQ):** (Dash-Dotted Purple Line) Starts at approximately -10 and decreases to around -65 by layer 15, then increases to approximately -50 by layer 25.
* **A-Anchored (NQ):** (Dotted Gray Line) Remains relatively stable around -5 to -10 across all layers.
### Key Observations
* The "Q-Anchored" series (PopQA, TriviaQA, HotpotQA, and NQ) show a significant decrease in ΔP (performance) as the layer number increases up to a certain point (around layer 10-15), after which the performance starts to recover slightly.
* The "A-Anchored" series (PopQA, TriviaQA, HotpotQA, and NQ) remain relatively stable across all layers, with ΔP values close to 0.
* The Llama-3.2-3B model (right graph) has more layers (up to 25) compared to the Llama-3.2-1B model (left graph, up to 15).
* The performance dip in the "Q-Anchored" series appears to be more pronounced in the Llama-3.2-3B model.
### Interpretation
The data suggests that anchoring the question (Q-Anchored) in these question-answering tasks leads to a performance decrease in the middle layers of the Llama models, followed by a slight recovery in later layers. This could indicate that the model initially struggles to process the question information in the earlier layers but adapts and improves its performance in the later layers.
On the other hand, anchoring the answer (A-Anchored) results in a stable performance across all layers, suggesting that the model can effectively utilize the answer information from the beginning.
The difference in the number of layers between the two models (Llama-3.2-1B and Llama-3.2-3B) and the more pronounced performance dip in the Llama-3.2-3B model could indicate that the larger model experiences a more significant initial challenge in processing the question information.