## Line Chart: Attention Key Query Score Performance
### Overview
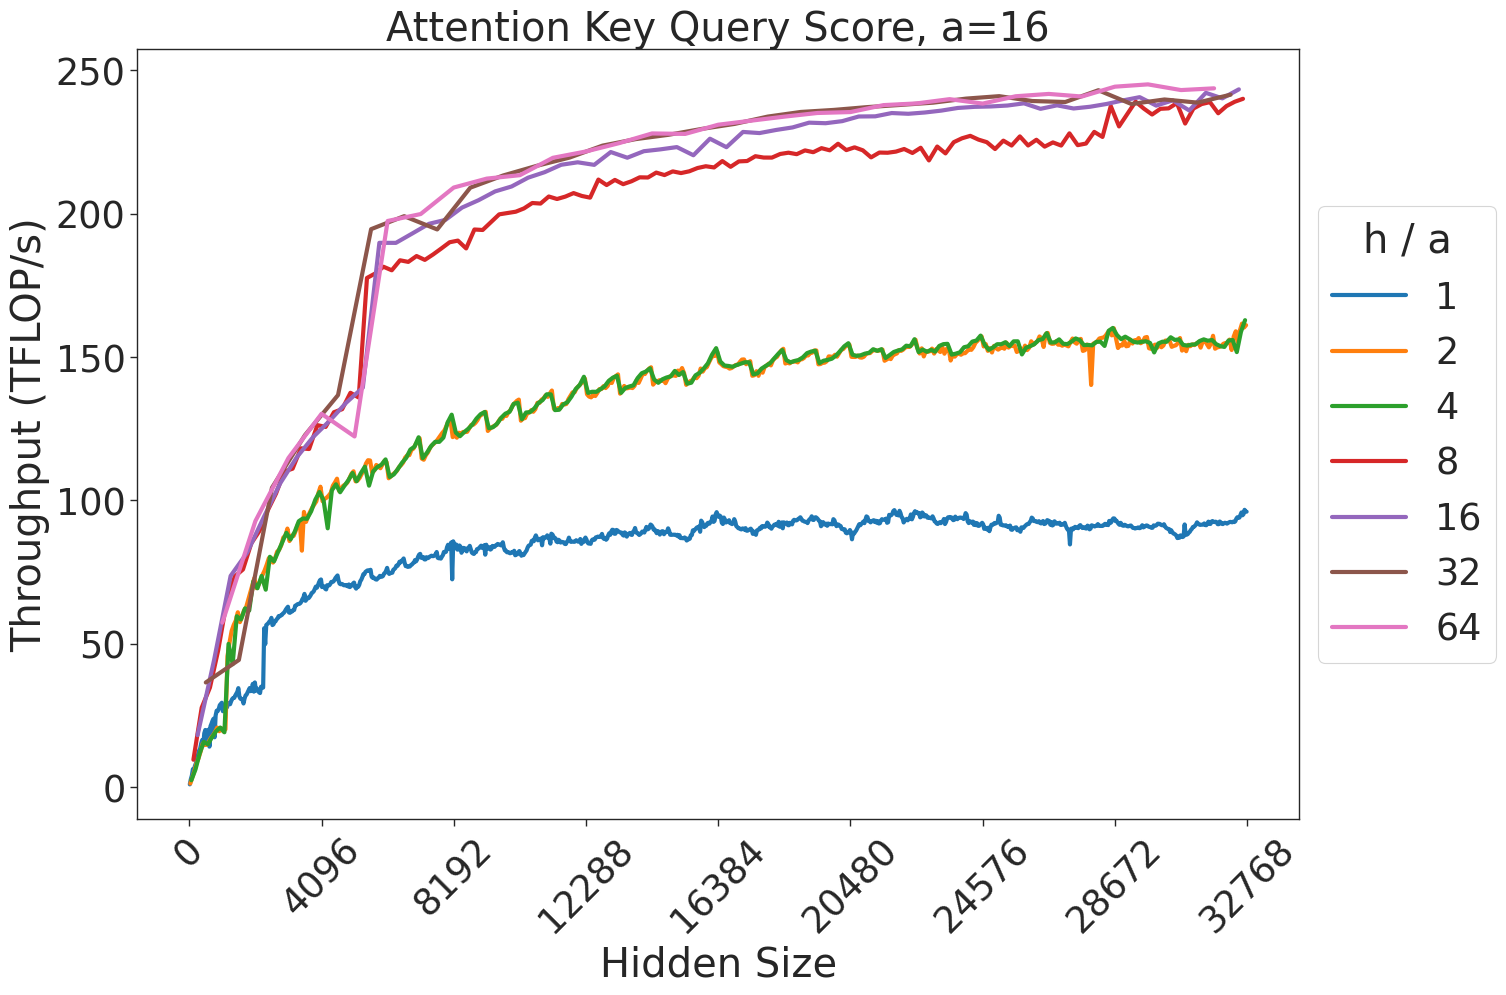
This chart illustrates the relationship between the "Hidden Size" of a computational model and its "Throughput (TFLOP/s)" across various "h / a" (head-to-attention dimension) ratios. The data demonstrates how computational efficiency scales as the model size increases, revealing distinct performance tiers and saturation points.
### Components/Axes
* **Title:** "Attention Key Query Score, a=16"
* **Y-Axis:** "Throughput (TFLOP/s)". The scale ranges from 0 to 250, with major grid lines at 50-unit intervals.
* **X-Axis:** "Hidden Size". The scale ranges from 0 to 32768, with major tick marks at intervals of 4096.
* **Legend:** Positioned on the right side of the chart. It defines the "h / a" ratio for seven distinct data series, color-coded as follows:
* **Blue:** 1
* **Orange:** 2
* **Green:** 4
* **Red:** 8
* **Purple:** 16
* **Brown:** 32
* **Pink:** 64
### Detailed Analysis
The data series exhibit a consistent logarithmic-style growth pattern, characterized by a steep initial increase followed by a gradual leveling off (saturation) as the Hidden Size increases.
**Trend Verification & Data Points:**
* **Initial Phase (0 to ~4096):** All lines show a steep, nearly linear upward slope.
* At Hidden Size ~4096, the throughput values are approximately:
* h/a=1 (Blue): ~60 TFLOP/s
* h/a=2, 4 (Orange, Green): ~100 TFLOP/s
* h/a=8 (Red): ~180 TFLOP/s
* h/a=16, 32, 64 (Purple, Brown, Pink): ~190–200 TFLOP/s
* **Saturation Phase (~4096 to 32768):** After the 4096 mark, the rate of throughput increase slows significantly for all series.
* At Hidden Size ~32768, the throughput values are approximately:
* h/a=1 (Blue): ~95 TFLOP/s
* h/a=2, 4 (Orange, Green): ~160 TFLOP/s
* h/a=8 (Red): ~240 TFLOP/s
* h/a=16, 32, 64 (Purple, Brown, Pink): ~245 TFLOP/s
### Key Observations
* **Performance Clustering:** The data series cluster into three distinct performance bands:
1. **Low Tier:** h/a = 1.
2. **Mid Tier:** h/a = 2 and 4 (these lines overlap almost perfectly).
3. **High Tier:** h/a = 8, 16, 32, and 64.
* **Diminishing Returns:** The difference in throughput between h/a=16, 32, and 64 is negligible, indicating that increasing the h/a ratio beyond 16 yields almost no additional performance benefit.
* **Inflection Point:** There is a sharp, distinct inflection point at a Hidden Size of 4096 for the higher-performing series (h/a ≥ 8). This suggests a transition in how the underlying hardware or software kernel handles the workload (e.g., switching to a more optimized tiling strategy or memory access pattern).
### Interpretation
This chart likely represents the performance profiling of a GPU-accelerated attention mechanism (such as FlashAttention).
* **Hardware/Software Efficiency:** The clustering of the higher h/a ratios (16, 32, 64) suggests that the hardware is reaching a compute-bound or memory-bandwidth-bound limit. Once the h/a ratio reaches 16, the system is likely fully utilizing the available resources, making further increases in the ratio redundant.
* **The "4096" Threshold:** The sharp jump at 4096 is highly significant. It implies that for smaller hidden sizes, the workload is too small to effectively parallelize across the GPU cores. At 4096, the workload size becomes sufficient to saturate the GPU's execution units, leading to the observed jump in throughput.
* **Practical Application:** For developers or researchers optimizing these models, this data suggests that there is little benefit to tuning the h/a ratio beyond 16, and that performance is most sensitive to changes in Hidden Size below 8192.