\n
## Diagram: Data Flow Representation
### Overview
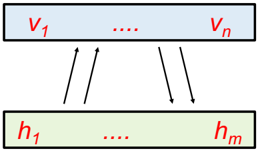
The image depicts a diagram illustrating a data flow or mapping between two sets of elements. A top rectangular block labeled with variables `v1` to `vn` is connected to a bottom rectangular block labeled with variables `h1` to `hm` via a series of directed arrows. The diagram appears to represent a function or transformation that maps elements from the top set to elements in the bottom set.
### Components/Axes
The diagram consists of two rectangular blocks and a set of directed arrows.
* **Top Block:** Filled with a light blue color. Labeled with `v1` on the left and `vn` on the right, with ellipsis (`....`) indicating intermediate elements.
* **Bottom Block:** Filled with a light green color. Labeled with `h1` on the left and `hm` on the right, with ellipsis (`....`) indicating intermediate elements.
* **Arrows:** Black, directed arrows connecting elements from the top block to the bottom block. The arrows point downwards, indicating a mapping or transformation.
### Detailed Analysis or Content Details
The diagram shows a mapping from a set of `n` variables (v1 to vn) to a set of `m` variables (h1 to hm). The arrows indicate that each variable in the top set can potentially map to one or more variables in the bottom set. The exact nature of the mapping is not specified, but the arrows suggest a functional relationship.
There are four arrows shown.
* The first arrow originates approximately from the center of the left side of the top block and points to the left side of the bottom block.
* The second arrow originates approximately from the center of the top block and points to the center of the bottom block.
* The third arrow originates approximately from the center of the top block and points to the right side of the bottom block.
* The fourth arrow originates approximately from the right side of the top block and points to the right side of the bottom block.
### Key Observations
The diagram highlights a relationship between two sets of variables. The use of ellipsis suggests that the number of variables in each set is not limited to the explicitly labeled ones. The arrows indicate a directed mapping, but the diagram does not specify whether the mapping is one-to-one, one-to-many, or many-to-one.
### Interpretation
This diagram likely represents a function or transformation that maps input variables (v1 to vn) to output variables (h1 to hm). It could be a simplified representation of a neural network layer, a feature extraction process, or any other mapping operation. The diagram emphasizes the flow of information from the input set to the output set. The lack of specific details about the mapping function suggests that the diagram is intended to be a general illustration of a data flow concept rather than a specific implementation. The diagram does not provide any quantitative data or specific values, but it conveys the essential idea of a mapping between two sets of variables.