## Line Chart: Norm Ratio vs. Layers
### Overview
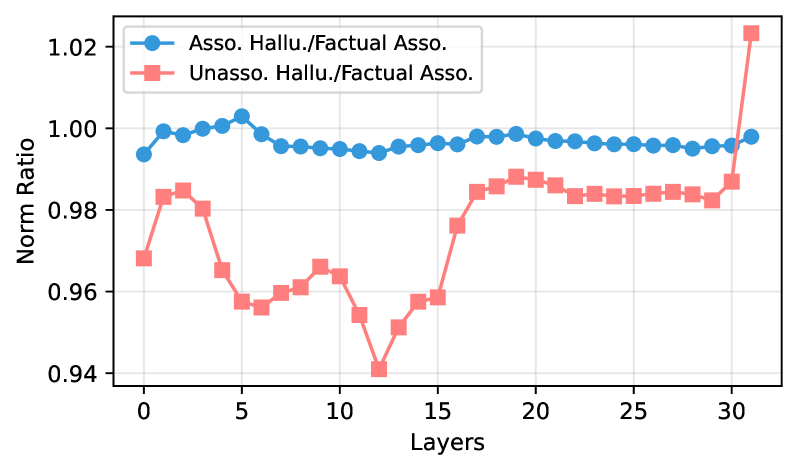
The image is a line chart comparing the "Norm Ratio" across different "Layers" for two categories: "Asso. Hallu./Factual Asso." and "Unasso. Hallu./Factual Asso.". The x-axis represents the layers, ranging from 0 to 30. The y-axis represents the Norm Ratio, ranging from 0.94 to 1.02.
### Components/Axes
* **Title:** None explicitly present in the image.
* **X-axis:**
* Label: "Layers"
* Scale: 0 to 30, with tick marks at intervals of 5 (0, 5, 10, 15, 20, 25, 30).
* **Y-axis:**
* Label: "Norm Ratio"
* Scale: 0.94 to 1.02, with tick marks at intervals of 0.02 (0.94, 0.96, 0.98, 1.00, 1.02).
* **Legend:** Located in the top-left corner.
* Blue line with circle markers: "Asso. Hallu./Factual Asso."
* Red line with square markers: "Unasso. Hallu./Factual Asso."
### Detailed Analysis
* **Asso. Hallu./Factual Asso. (Blue Line):**
* Trend: Relatively stable with minor fluctuations.
* Data Points:
* Layer 0: Approximately 0.993
* Layer 5: Approximately 1.002
* Layer 10: Approximately 0.993
* Layer 15: Approximately 0.993
* Layer 20: Approximately 0.997
* Layer 25: Approximately 0.995
* Layer 30: Approximately 0.998
* **Unasso. Hallu./Factual Asso. (Red Line):**
* Trend: More volatile, with a significant dip around layer 13 and a sharp increase at the end.
* Data Points:
* Layer 0: Approximately 0.968
* Layer 5: Approximately 0.958
* Layer 10: Approximately 0.964
* Layer 13: Approximately 0.940
* Layer 15: Approximately 0.959
* Layer 20: Approximately 0.987
* Layer 25: Approximately 0.984
* Layer 30: Approximately 0.987
* Layer 31: Approximately 1.025
### Key Observations
* The "Asso. Hallu./Factual Asso." line remains relatively constant across all layers, hovering around a Norm Ratio of 1.00.
* The "Unasso. Hallu./Factual Asso." line shows more variation, with a notable dip around layer 13 and a sharp spike at layer 31.
* The "Unasso. Hallu./Factual Asso." line is generally below the "Asso. Hallu./Factual Asso." line, except for the final point at layer 31.
### Interpretation
The chart compares the norm ratios of two different associations ("Asso. Hallu./Factual Asso." and "Unasso. Hallu./Factual Asso.") across different layers. The relatively stable norm ratio for "Asso. Hallu./Factual Asso." suggests a consistent behavior across layers. In contrast, the "Unasso. Hallu./Factual Asso." exhibits more dynamic behavior, indicating that its norm ratio is more sensitive to the specific layer. The significant dip around layer 13 and the sharp increase at the end suggest that certain layers have a more pronounced effect on the "Unasso. Hallu./Factual Asso." compared to the "Asso. Hallu./Factual Asso.". This could indicate that the "Unasso. Hallu./Factual Asso." is more susceptible to changes or anomalies within specific layers of the model.