## Diagram: Intracellular Signaling Pathway and Calcium Dynamics
### Overview
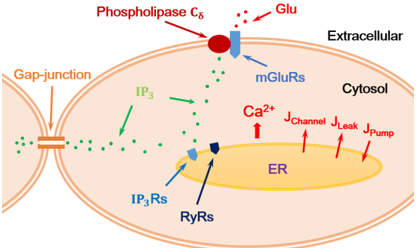
This diagram illustrates a cellular signaling pathway involving extracellular glutamate (Glu), metabotropic glutamate receptors (mGluRs), phospholipase C8 (PLC8), inositol trisphosphate (IP3), calcium ions (Ca²⁺), and their regulation via the endoplasmic reticulum (ER), gap junctions, and ion channels/pumps. The diagram emphasizes spatial relationships between membrane-bound receptors, intracellular messengers, and organelles.
### Components/Axes
- **Key Labels**:
- **Phospholipase C8 (PLC8)**: Red oval near the top, extracellular side of the membrane.
- **Glu (Glutamate)**: Extracellular space, labeled with red dots.
- **mGluRs (Metabotropic Glutamate Receptors)**: Blue ovals on the plasma membrane.
- **IP3 (Inositol Trisphosphate)**: Green dots diffusing from mGluRs toward the ER.
- **Ca²⁺ (Calcium Ions)**: Red upward arrow from the ER lumen.
- **J_Channel, J_Leak, J_Pump**: Red arrows indicating ion flux (channel, leak, pump).
- **ER (Endoplasmic Reticulum)**: Yellow oval in the cytosol.
- **IP3Rs (IP3 Receptors)**: Blue ovals on the ER membrane.
- **RyRs (Ryanodine Receptors)**: Dark blue ovals on the ER membrane.
- **Gap-junction**: Orange structure connecting two adjacent cells.
- **Spatial Grounding**:
- **Extracellular**: Top region, labeled with "Extracellular" and Glu.
- **Plasma Membrane**: Central beige region with mGluRs and gap-junction.
- **Cytosol**: Light orange region below the membrane.
- **ER Lumen**: Yellow oval in the cytosol, labeled "ER."
### Detailed Analysis
1. **Signal Initiation**:
- Extracellular Glu binds to mGluRs (blue ovals), activating PLC8 (red oval).
- PLC8 hydrolyzes PIP2 to produce IP3 (green dots), which diffuses into the cytosol.
2. **Calcium Release**:
- IP3 binds to IP3Rs (blue ovals) on the ER membrane, triggering Ca²⁺ release (red upward arrow).
- Concurrently, RyRs (dark blue ovals) on the ER membrane may also mediate Ca²⁺ release, though their activation mechanism is not explicitly shown.
3. **Ion Regulation**:
- **J_Channel**: Red upward arrow suggests Ca²⁺ influx into the cytosol.
- **J_Leak**: Red downward arrow indicates passive Ca²⁺ efflux.
- **J_Pump**: Red downward arrow represents active Ca²⁺ extrusion via pumps (e.g., SERCA).
4. **Gap-junction Communication**:
- IP3 (green dots) propagates through the gap-junction (orange structure) to adjacent cells, enabling intercellular signaling.
### Key Observations
- **Dominant Pathway**: Glu → mGluR → PLC8 → IP3 → Ca²⁺ release from ER.
- **Redundancy**: Both IP3Rs and RyRs are shown as Ca²⁺ release channels, suggesting overlapping mechanisms.
- **Ion Homeostasis**: J_Channel, J_Leak, and J_Pump regulate cytosolic Ca²⁺ levels, preventing toxicity.
- **Spatial Organization**: ER is centrally located, emphasizing its role as a Ca²⁺ store.
### Interpretation
This diagram highlights the integration of extracellular signaling (Glu) with intracellular Ca²⁺ dynamics. The activation of mGluRs by Glu initiates a cascade that mobilizes Ca²⁺ from the ER, a critical second messenger in processes like muscle contraction, neurotransmitter release, and gene expression. The gap-junction allows IP3 to propagate signals between cells, enabling synchronized responses. The inclusion of J_Channel, J_Leak, and J_Pump underscores the importance of precise Ca²⁺ regulation to maintain cellular function. Notably, the diagram does not specify temporal dynamics (e.g., Ca²⁺ transient duration), which would be critical for understanding physiological outcomes. The absence of quantitative data (e.g., IP3 concentration, Ca²⁺ flux rates) limits mechanistic insights but effectively conveys the pathway's architecture.