## Line Chart: AUC-PR vs. Number of Samples
### Overview
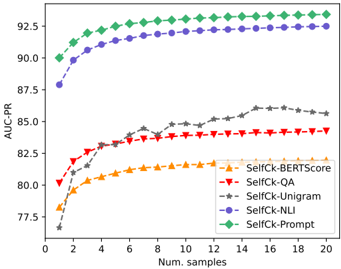
This image presents a line chart illustrating the relationship between the Area Under the Precision-Recall Curve (AUC-PR) and the number of samples used, for five different methods: SelfCk-BERTScore, SelfCk-QA, SelfCk-Unigram, SelfCk-NLI, and SelfCk-Prompt. The chart aims to demonstrate how performance (AUC-PR) changes as the sample size increases for each method.
### Components/Axes
* **X-axis:** "Num. samples" - Represents the number of samples, ranging from 0 to 20, with markers at integer values.
* **Y-axis:** "AUC-PR" - Represents the Area Under the Precision-Recall Curve, ranging from approximately 79.5 to 93, with markers at 0.5 increments.
* **Legend:** Located in the bottom-right corner of the chart. It identifies each line with a specific color and label:
* SelfCk-BERTScore (Orange)
* SelfCk-QA (Red)
* SelfCk-Unigram (Gray)
* SelfCk-NLI (Blue)
* SelfCk-Prompt (Green)
### Detailed Analysis
Let's analyze each line individually, noting trends and approximate data points.
* **SelfCk-Prompt (Green):** This line shows a rapid initial increase, reaching a plateau around 92.5 AUC-PR between 6 and 20 samples.
* At 0 samples: ~89.0 AUC-PR
* At 2 samples: ~91.0 AUC-PR
* At 4 samples: ~92.0 AUC-PR
* At 6 samples: ~92.5 AUC-PR
* At 20 samples: ~92.5 AUC-PR
* **SelfCk-NLI (Blue):** This line also shows a quick increase, leveling off around 92.3 AUC-PR between 4 and 20 samples.
* At 0 samples: ~89.5 AUC-PR
* At 2 samples: ~90.5 AUC-PR
* At 4 samples: ~91.8 AUC-PR
* At 6 samples: ~92.2 AUC-PR
* At 20 samples: ~92.3 AUC-PR
* **SelfCk-Unigram (Gray):** This line exhibits a slower, more gradual increase, reaching approximately 85 AUC-PR at 20 samples.
* At 0 samples: ~79.5 AUC-PR
* At 2 samples: ~82.0 AUC-PR
* At 4 samples: ~83.0 AUC-PR
* At 6 samples: ~83.5 AUC-PR
* At 20 samples: ~85.0 AUC-PR
* **SelfCk-QA (Red):** This line shows a moderate increase, plateauing around 84.5 AUC-PR between 8 and 20 samples.
* At 0 samples: ~80.0 AUC-PR
* At 2 samples: ~82.5 AUC-PR
* At 4 samples: ~83.5 AUC-PR
* At 6 samples: ~84.0 AUC-PR
* At 20 samples: ~84.5 AUC-PR
* **SelfCk-BERTScore (Orange):** This line shows an initial increase, then plateaus around 81.5 AUC-PR between 6 and 20 samples.
* At 0 samples: ~80.0 AUC-PR
* At 2 samples: ~81.0 AUC-PR
* At 4 samples: ~81.5 AUC-PR
* At 6 samples: ~81.5 AUC-PR
* At 20 samples: ~81.5 AUC-PR
### Key Observations
* SelfCk-Prompt and SelfCk-NLI consistently outperform the other methods across all sample sizes.
* SelfCk-Unigram and SelfCk-BERTScore show the lowest performance.
* The performance gains for SelfCk-Prompt and SelfCk-NLI diminish significantly after approximately 6 samples.
* The lines for SelfCk-Prompt, SelfCk-NLI, SelfCk-QA, and SelfCk-BERTScore all show an initial steep increase, indicating that adding even a small number of samples can significantly improve performance.
### Interpretation
The data suggests that SelfCk-Prompt and SelfCk-NLI are the most effective methods for this task, achieving high AUC-PR values with relatively few samples. The diminishing returns observed after 6 samples indicate that increasing the sample size beyond this point provides limited additional benefit for these methods. SelfCk-Unigram and SelfCk-BERTScore, while showing some improvement with increasing samples, consistently underperform the other methods, suggesting they may be less suitable for this particular task. The rapid initial gains across all methods suggest that even a small amount of data can be valuable for training and evaluating these models. The differences in performance between the methods likely reflect variations in their ability to capture relevant information from the data and generalize to unseen examples. The chart provides valuable insights into the trade-off between sample size and performance for each method, allowing for informed decisions about data collection and model selection.