## Line Graph: AUC-PR Performance Across Number of Samples
### Overview
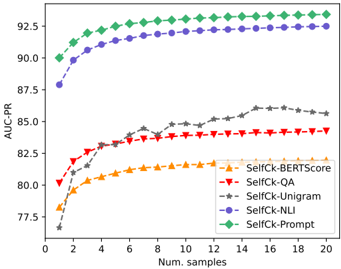
The image is a line graph comparing the performance of five different methods (SelfCk-BERTScore, SelfCk-QA, SelfCk-Unigram, SelfCk-NLI, SelfCk-Prompt) in terms of AUC-PR (Area Under the Precision-Recall Curve) as the number of samples increases from 0 to 20. The graph shows how each method's performance evolves with increasing data samples.
### Components/Axes
- **X-axis**: "Num. samples" (number of samples), ranging from 0 to 20 in increments of 2.
- **Y-axis**: "AUC-PR" (Area Under the Precision-Recall Curve), ranging from 77.5 to 92.5 in increments of 2.5.
- **Legend**: Located in the bottom-right corner, with five entries:
- **SelfCk-BERTScore**: Yellow triangles (▲)
- **SelfCk-QA**: Red triangles (▼)
- **SelfCk-Unigram**: Gray stars (★)
- **SelfCk-NLI**: Blue circles (●)
- **SelfCk-Prompt**: Green diamonds (◆)
### Detailed Analysis
1. **SelfCk-Prompt (Green Diamonds)**:
- Starts at approximately 90 AUC-PR at 0 samples.
- Shows a slight upward trend, plateauing near 92.5 AUC-PR by 20 samples.
- Maintains the highest performance across all sample sizes.
2. **SelfCk-NLI (Blue Circles)**:
- Begins at ~87.5 AUC-PR at 0 samples.
- Increases steadily, reaching ~92.0 AUC-PR by 20 samples.
- Second-highest performance overall.
3. **SelfCk-QA (Red Triangles)**:
- Starts at ~80 AUC-PR at 0 samples.
- Rises gradually, stabilizing around ~84 AUC-PR by 20 samples.
- Mid-range performance.
4. **SelfCk-Unigram (Gray Stars)**:
- Begins at ~77.5 AUC-PR at 0 samples.
- Shows a moderate increase, reaching ~85 AUC-PR by 20 samples.
- Lower performance compared to other methods.
5. **SelfCk-BERTScore (Yellow Triangles)**:
- Starts at ~78 AUC-PR at 0 samples.
- Increases slowly, plateauing near ~82 AUC-PR by 20 samples.
- Lowest performance among the five methods.
### Key Observations
- **SelfCk-Prompt** consistently outperforms all other methods, maintaining the highest AUC-PR across all sample sizes.
- **SelfCk-NLI** shows the most significant improvement with increasing samples, closing the gap with SelfCk-Prompt.
- **SelfCk-QA** and **SelfCk-Unigram** exhibit moderate growth, while **SelfCk-BERTScore** has the slowest improvement.
- All methods show a general upward trend, indicating that performance improves with more samples, but the rate of improvement varies.
### Interpretation
The data suggests that **SelfCk-Prompt** is the most effective method for the task, likely due to its robust design or optimization. **SelfCk-NLI** demonstrates strong scalability, making it a viable alternative for larger datasets. The slower improvement of **SelfCk-BERTScore** and **SelfCk-Unigram** may indicate limitations in their architectures or training processes. The graph highlights the importance of method selection based on dataset size and performance requirements. Notably, the plateauing of SelfCk-Prompt at higher sample sizes suggests diminishing returns beyond a certain point, which could inform resource allocation in practical applications.