\n
## Diagram: State Transitions with Value Changes
### Overview
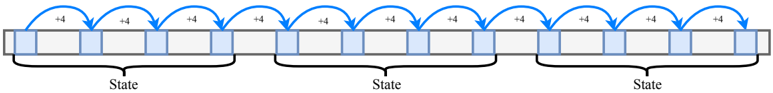
The image depicts a linear sequence of states, each represented by a rectangular block. Arrows indicate transitions between these states, accompanied by a numerical value "+4" or "-4". The diagram illustrates a system undergoing changes in state, with each transition involving a modification of a value.
### Components/Axes
The diagram consists of the following components:
* **States:** Represented by rectangular blocks. Three states are explicitly labeled.
* **Transitions:** Represented by curved arrows connecting the states.
* **Value Change:** Each transition arrow is labeled with either "+4" or "-4", indicating the change in value during the transition.
* **Labels:** The word "State" appears three times, labeling sections of the diagram.
### Detailed Analysis or Content Details
The diagram shows a series of states connected by transitions. The transitions alternate between adding 4 and subtracting 4.
* The first state consists of 5 blocks. The transition from the first block to the second is labeled "+4".
* The second state consists of 5 blocks. The transition from the second block to the third is labeled "-4".
* The third state consists of 5 blocks. The transition from the third block to the fourth is labeled "+4".
* This pattern of "+4" and "-4" transitions continues across the entire diagram.
* The diagram shows a total of 15 blocks representing states.
### Key Observations
The diagram demonstrates a cyclical pattern of value changes. The transitions alternate between adding and subtracting a constant value (4). The diagram does not provide any initial or final state values, only the changes between states.
### Interpretation
The diagram likely represents a simplified model of a system where a value is repeatedly incremented and decremented. This could represent a counter, a signal strength, or any other measurable quantity. The "states" could represent discrete time steps or distinct configurations of the system. The consistent "+4" and "-4" transitions suggest a predictable and controlled process. The diagram does not provide information about the underlying mechanism driving these changes, or the purpose of the state transitions. It is a purely visual representation of a value fluctuating between states.