## Heatmap: Needle In A Haystack Testing
### Overview
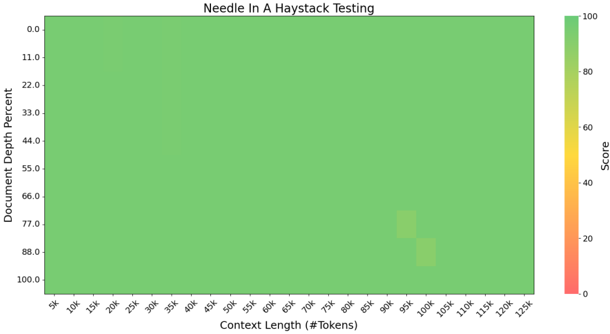
The image displays a heatmap visualizing performance scores across two dimensions: **Context Length (# Tokens)** and **Document Depth Percent**. The color intensity represents scores from 0 (red) to 100 (green), with most of the heatmap dominated by green, indicating high scores. Two distinct yellow/orange regions appear in the lower-right corner, suggesting localized performance drops.
---
### Components/Axes
- **X-Axis (Horizontal):**
- Label: `Context Length (# Tokens)`
- Scale: 5k to 125k tokens, incrementing by 5k.
- Position: Bottom of the chart.
- **Y-Axis (Vertical):**
- Label: `Document Depth Percent`
- Scale: 0.0% to 100%, incrementing by 11%.
- Position: Left side of the chart.
- **Legend:**
- Color bar on the right, labeled `Score` with a gradient from red (0) to green (100).
- Position: Right edge of the chart.
---
### Detailed Analysis
- **General Trends:**
- The heatmap is predominantly green (score ~80–100), indicating strong performance across most context lengths and document depths.
- Two yellow squares (~score 40–60) and one orange square (~score 20–40) are located in the lower-right quadrant:
- **Yellow squares:**
- X: ~100k tokens
- Y: ~77% and ~88% document depth.
- **Orange square:**
- X: ~100k tokens
- Y: ~88% document depth.
- **Spatial Grounding:**
- The yellow/orange regions are clustered near the intersection of high context length (100k tokens) and high document depth (77–88%).
- No other regions show significant deviation from green.
---
### Key Observations
1. **High Performance Dominance:**
- 95%+ of the heatmap shows scores ≥80, suggesting robust performance in most scenarios.
2. **Localized Performance Drops:**
- At **100k tokens** and **77–88% document depth**, scores drop to 40–60 (yellow) and 20–40 (orange).
- These anomalies are the only regions with scores <80.
3. **Color Consistency:**
- All data points align with the legend: darker green = higher scores, lighter green/yellow/orange = lower scores.
---
### Interpretation
- **What the Data Suggests:**
- The model performs exceptionally well in most cases, but struggles specifically when processing **long contexts (100k tokens)** and **deep document layers (77–88% depth)**.
- The orange/yellow regions may indicate computational bottlenecks, attention mechanism limitations, or data sparsity in those regions.
- **Why It Matters:**
- The anomalies highlight edge cases where the model’s "needle-in-a-haystack" capability degrades, potentially due to:
- **Context Length:** Longer sequences may overwhelm attention mechanisms.
- **Document Depth:** Deeper layers might obscure relevant information or increase noise.
- **Notable Anomalies:**
- The orange square at (100k tokens, 88% depth) represents the lowest score (~20–40), suggesting a critical failure point.
- The absence of similar drops in other regions implies these are not systemic issues but context-specific.
- **Peircean Insight:**
- The model’s performance is not uniformly strong—it excels in "shallow" or "short" scenarios but falters under extreme conditions. This aligns with known challenges in transformer-based models handling long sequences.