## Line Chart: Mistral-7B-v0.1 vs Mistral-7B-v0.3
### Overview
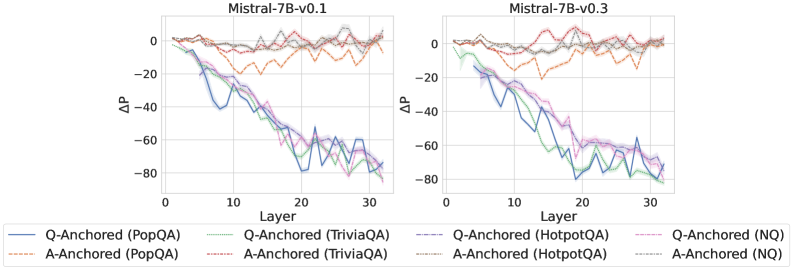
The image presents two line charts comparing the performance of Mistral-7B-v0.1 and Mistral-7B-v0.3 models across different layers (1 to 32) and question-answering datasets. The y-axis represents ΔP, a performance metric, while the x-axis represents the layer number. Each chart displays six data series, representing different combinations of anchoring (Q-Anchored or A-Anchored) and question-answering datasets (PopQA, TriviaQA, HotpotQA, NQ).
### Components/Axes
* **Titles:**
* Left Chart: Mistral-7B-v0.1
* Right Chart: Mistral-7B-v0.3
* **X-axis:**
* Label: Layer
* Scale: 0 to 30, with tick marks at intervals of 10.
* **Y-axis:**
* Label: ΔP
* Scale: -80 to 0, with tick marks at intervals of 20.
* **Legend:** Located at the bottom of the chart.
* Q-Anchored (PopQA): Solid Blue Line
* A-Anchored (PopQA): Dashed Brown Line
* Q-Anchored (TriviaQA): Dotted Green Line
* A-Anchored (TriviaQA): Dashed-Dotted Gray Line
* Q-Anchored (HotpotQA): Dashed Purple Line
* A-Anchored (HotpotQA): Dotted Red Line
* Q-Anchored (NQ): Dashed-Dotted Purple Line
* A-Anchored (NQ): Dotted Gray Line
### Detailed Analysis
**Left Chart: Mistral-7B-v0.1**
* **Q-Anchored (PopQA):** (Solid Blue Line) Starts at approximately 0 and decreases to around -70 by layer 15, then fluctuates between -60 and -75 until layer 30.
* **A-Anchored (PopQA):** (Dashed Brown Line) Remains relatively stable around 0, with minor fluctuations between -5 and 5 across all layers.
* **Q-Anchored (TriviaQA):** (Dotted Green Line) Starts near 0 and decreases to approximately -60 by layer 15, then fluctuates between -50 and -65 until layer 30.
* **A-Anchored (TriviaQA):** (Dashed-Dotted Gray Line) Remains relatively stable around 0, with minor fluctuations between -5 and 5 across all layers.
* **Q-Anchored (HotpotQA):** (Dashed Purple Line) Starts near 0 and decreases to approximately -50 by layer 15, then fluctuates between -50 and -70 until layer 30.
* **A-Anchored (HotpotQA):** (Dotted Red Line) Remains relatively stable around 0, with minor fluctuations between -5 and 5 across all layers.
* **Q-Anchored (NQ):** (Dashed-Dotted Purple Line) Starts near 0 and decreases to approximately -50 by layer 15, then fluctuates between -50 and -70 until layer 30.
* **A-Anchored (NQ):** (Dotted Gray Line) Remains relatively stable around 0, with minor fluctuations between -5 and 5 across all layers.
**Right Chart: Mistral-7B-v0.3**
* **Q-Anchored (PopQA):** (Solid Blue Line) Starts at approximately 0 and decreases to around -60 by layer 15, then fluctuates between -50 and -75 until layer 30.
* **A-Anchored (PopQA):** (Dashed Brown Line) Remains relatively stable around 0, with minor fluctuations between -5 and 5 across all layers.
* **Q-Anchored (TriviaQA):** (Dotted Green Line) Starts near 0 and decreases to approximately -50 by layer 15, then fluctuates between -50 and -70 until layer 30.
* **A-Anchored (TriviaQA):** (Dashed-Dotted Gray Line) Remains relatively stable around 0, with minor fluctuations between -5 and 5 across all layers.
* **Q-Anchored (HotpotQA):** (Dashed Purple Line) Starts near 0 and decreases to approximately -50 by layer 15, then fluctuates between -50 and -70 until layer 30.
* **A-Anchored (HotpotQA):** (Dotted Red Line) Remains relatively stable around 0, with minor fluctuations between -5 and 5 across all layers.
* **Q-Anchored (NQ):** (Dashed-Dotted Purple Line) Starts near 0 and decreases to approximately -50 by layer 15, then fluctuates between -50 and -70 until layer 30.
* **A-Anchored (NQ):** (Dotted Gray Line) Remains relatively stable around 0, with minor fluctuations between -5 and 5 across all layers.
### Key Observations
* The "Q-Anchored" series (PopQA, TriviaQA, HotpotQA, NQ) show a significant decrease in ΔP as the layer number increases, indicating a performance drop.
* The "A-Anchored" series (PopQA, TriviaQA, HotpotQA, NQ) remain relatively stable near 0, suggesting minimal performance change across layers.
* The performance drop in "Q-Anchored" series seems to stabilize after layer 15.
* The Mistral-7B-v0.3 model shows a slightly less pronounced performance drop in the "Q-Anchored" series compared to Mistral-7B-v0.1.
### Interpretation
The data suggests that anchoring the question (Q-Anchored) leads to a performance degradation as the model processes deeper layers, while anchoring the answer (A-Anchored) maintains a stable performance. This could indicate that the model struggles to maintain relevant information from the question as it progresses through the layers, while the answer information remains more consistent. The slight improvement in Mistral-7B-v0.3 suggests some optimization in handling question information across layers, but the overall trend remains consistent. The performance drop stabilization after layer 15 might indicate a point where the model's processing reaches a steady state or a bottleneck.