## Line Chart: Cosine Similarity vs. Layers
### Overview
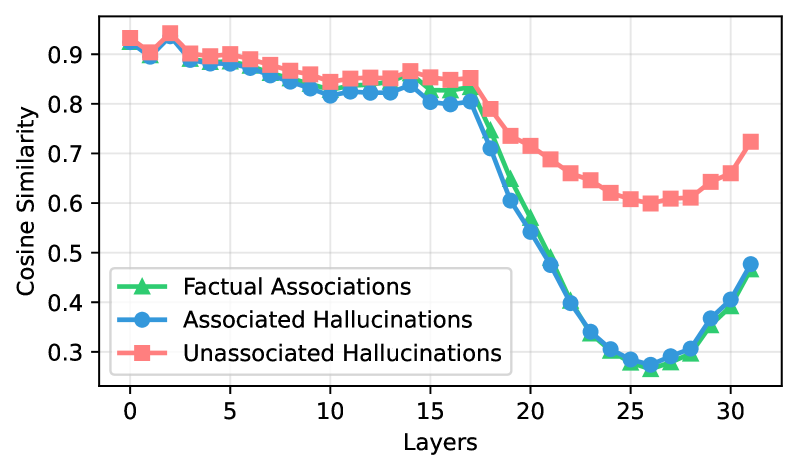
The image is a line chart comparing the cosine similarity across different layers for three categories: Factual Associations, Associated Hallucinations, and Unassociated Hallucinations. The x-axis represents the layers, ranging from 0 to 30. The y-axis represents the cosine similarity, ranging from 0.3 to 0.9.
### Components/Axes
* **X-axis:** Layers, ranging from 0 to 30 in increments of 5.
* **Y-axis:** Cosine Similarity, ranging from 0.3 to 0.9 in increments of 0.1.
* **Legend (bottom-left):**
* Green line with triangle markers: Factual Associations
* Blue line with circle markers: Associated Hallucinations
* Red line with square markers: Unassociated Hallucinations
### Detailed Analysis
* **Factual Associations (Green):**
* Trend: Initially high, slightly decreasing, then a sharp decline, followed by an increase.
* Values: Starts at approximately 0.92 at layer 0, decreases slightly to around 0.88 at layer 5, then drops sharply from approximately 0.82 at layer 15 to around 0.28 at layer 26, then increases to approximately 0.4 at layer 30.
* **Associated Hallucinations (Blue):**
* Trend: Similar to Factual Associations, with an initial high value, slight decrease, sharp decline, and then an increase.
* Values: Starts at approximately 0.92 at layer 0, decreases slightly to around 0.87 at layer 5, then drops sharply from approximately 0.82 at layer 15 to around 0.32 at layer 26, then increases to approximately 0.48 at layer 30.
* **Unassociated Hallucinations (Red):**
* Trend: Starts high, decreases gradually, then declines more slowly than the other two, and finally increases slightly.
* Values: Starts at approximately 0.93 at layer 0, decreases gradually to around 0.86 at layer 15, then drops to approximately 0.6 at layer 26, then increases to approximately 0.72 at layer 31.
### Key Observations
* All three categories start with high cosine similarity values at the initial layers.
* Factual Associations and Associated Hallucinations show a similar trend, with a sharp decline in cosine similarity around layer 15-20.
* Unassociated Hallucinations maintain a higher cosine similarity compared to the other two categories after layer 20.
* The cosine similarity for Factual Associations and Associated Hallucinations reaches a minimum around layer 26 before increasing again.
### Interpretation
The chart suggests that as the layers increase, the cosine similarity for factual associations and associated hallucinations decreases significantly, indicating a potential divergence or weakening of the relationship. Unassociated hallucinations, however, maintain a relatively higher similarity, suggesting a different behavior or characteristic. The sharp decline around layers 15-20 could indicate a critical point where the representations or associations change significantly. The subsequent increase in similarity for Factual Associations and Associated Hallucinations after layer 26 might indicate a recovery or re-establishment of some form of association.