## Heatmap: Performance vs. Percentage and Width
### Overview
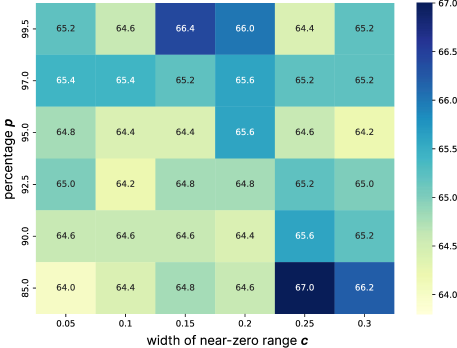
The image is a heatmap visualizing performance (represented by color intensity) as a function of two parameters: "percentage p" (y-axis) and "width of near-zero range c" (x-axis). The heatmap displays numerical values within each cell, indicating the performance score for the corresponding parameter combination. The color gradient ranges from light yellow (lower performance) to dark blue (higher performance), as indicated by the colorbar on the right.
### Components/Axes
* **X-axis:** "width of near-zero range c" with values 0.05, 0.1, 0.15, 0.2, 0.25, and 0.3.
* **Y-axis:** "percentage p" with values 85.0, 90.0, 92.5, 95.0, 97.0, and 99.5.
* **Colorbar:** Ranges from approximately 64.0 (light yellow) to 67.0 (dark blue), representing the performance score.
### Detailed Analysis
The heatmap displays the following performance values for each combination of "percentage p" and "width of near-zero range c":
| percentage p | 0.05 | 0.1 | 0.15 | 0.2 | 0.25 | 0.3 |
| :----------- | :--- | :--- | :--- | :--- | :--- | :--- |
| 99.5 | 65.2 | 64.6 | 66.4 | 66.0 | 64.4 | 65.2 |
| 97.0 | 65.4 | 65.4 | 65.2 | 65.6 | 65.2 | 65.2 |
| 95.0 | 64.8 | 64.4 | 64.4 | 65.6 | 64.6 | 64.2 |
| 92.5 | 65.0 | 64.2 | 64.8 | 64.8 | 65.2 | 65.0 |
| 90.0 | 64.6 | 64.6 | 64.6 | 64.4 | 65.6 | 65.2 |
| 85.0 | 64.0 | 64.4 | 64.8 | 64.6 | 67.0 | 66.2 |
**Trends:**
* For "percentage p = 85.0", the performance is relatively low for "width of near-zero range c" values from 0.05 to 0.2, then spikes to the highest value (67.0) at c = 0.25, and decreases slightly to 66.2 at c = 0.3.
* For "percentage p = 99.5", the performance is highest at c = 0.15 (66.4) and 0.2 (66.0).
* The highest performance value (67.0) is observed at "percentage p = 85.0" and "width of near-zero range c = 0.25".
* The lowest performance value (64.0) is observed at "percentage p = 85.0" and "width of near-zero range c = 0.05".
### Key Observations
* The performance varies significantly depending on the combination of "percentage p" and "width of near-zero range c".
* A "width of near-zero range c" of 0.25 appears to yield high performance when "percentage p" is low (85.0).
* Higher "percentage p" values (97.0 and 99.5) show relatively consistent performance across different "width of near-zero range c" values.
### Interpretation
The heatmap suggests that the optimal configuration of "percentage p" and "width of near-zero range c" depends on the specific application or context. A lower "percentage p" may benefit from a "width of near-zero range c" of 0.25, while higher "percentage p" values are less sensitive to changes in "width of near-zero range c". The data indicates that the relationship between these parameters is not linear, and careful tuning is required to achieve the best performance. The "width of near-zero range c" parameter seems to have a more significant impact on performance when the "percentage p" is at its lowest value.