\n
## Diagram: State Transition with Calculation Steps
### Overview
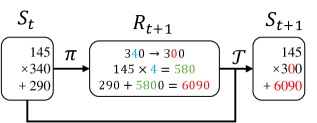
The image depicts a diagram illustrating a state transition process, likely within a computational or mathematical model. It shows a transformation from state *S<sub>t</sub>* to state *S<sub>t+1</sub>* via an intermediate state *R<sub>t+1</sub>*. The diagram includes specific calculations performed during the transition.
### Components/Axes
The diagram consists of three rectangular boxes labeled *S<sub>t</sub>*, *R<sub>t+1</sub>*, and *S<sub>t+1</sub>*, connected by arrows representing transformations. The arrows are labeled *π* and *T*. Within each box, numerical calculations are shown.
### Detailed Analysis or Content Details
**S<sub>t</sub> (Left Box):**
* Label: *S<sub>t</sub>*
* Calculations:
* 145
* × 340
* + 290
**R<sub>t+1</sub> (Center Box):**
* Label: *R<sub>t+1</sub>*
* Calculations:
* 340 → 300 (Green text)
* 145 × 4 = 580 (Green text)
* 290 + 580 = 6090 (Red text)
**S<sub>t+1</sub> (Right Box):**
* Label: *S<sub>t+1</sub>*
* Calculations:
* 145
* × 300
* + 6090
**Arrows:**
* Arrow 1: From *S<sub>t</sub>* to *R<sub>t+1</sub>*, labeled *π*
* Arrow 2: From *R<sub>t+1</sub>* to *S<sub>t+1</sub>*, labeled *T*
### Key Observations
The diagram shows a process where the initial state *S<sub>t</sub>* undergoes a transformation *π* to reach *R<sub>t+1</sub>*. The value 340 is modified to 300 within *R<sub>t+1</sub>*. The calculations within *R<sub>t+1</sub>* involve multiplication and addition, resulting in the value 6090. This value is then used in the calculation for *S<sub>t+1</sub>*. The color coding of the calculations within *R<sub>t+1</sub>* (green for intermediate steps, red for the final result) highlights the flow of computation.
### Interpretation
This diagram likely represents a step in an iterative process or a state update rule within a larger system. The transformations *π* and *T* could represent functions or operators that modify the state. The calculations suggest a weighted sum or a linear transformation. The change from 340 to 300 within *R<sub>t+1</sub>* could represent a scaling or normalization step. The overall process appears to be updating a state *S* based on a previous state and some intermediate calculations. The diagram is a visual representation of a mathematical or computational procedure, potentially related to a dynamic system or an algorithm. The use of subscripts (t and t+1) indicates a time-series or sequential nature of the state transitions.