## Chart: Comparison of MAML and Pretrained Models
### Overview
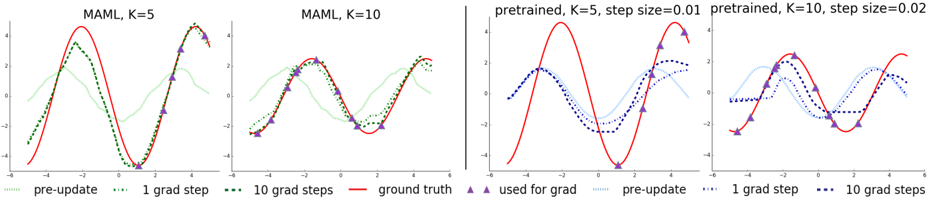
The image presents four line charts comparing the performance of MAML (Model-Agnostic Meta-Learning) and pretrained models with different configurations. Each chart displays the "ground truth" function (red line) along with the model's predictions after different numbers of gradient steps. The charts vary in the number of inner loop updates (K) and step size.
### Components/Axes
Each chart has the following components:
* **Title:** Specifies the model type (MAML or pretrained) and parameters (K value, step size).
* **X-axis:** Ranges from approximately -6 to 6. No explicit label is provided, but it likely represents the input to the function.
* **Y-axis:** Ranges from -4 to 4. No explicit label is provided, but it likely represents the output of the function.
* **Ground Truth:** Represented by a solid red line.
* **Pre-update:** Represented by a light green dotted line (MAML) or light blue dotted line (pretrained).
* **1 grad step:** Represented by a dark green dotted line (MAML) or dark blue dotted line (pretrained).
* **10 grad steps:** Represented by a dark green dashed line (MAML) or dark blue dashed line (pretrained).
* **Used for grad:** Represented by purple triangles.
The legend is located at the bottom of the image and applies to all four charts.
### Detailed Analysis
**Chart 1: MAML, K=5**
* **Ground Truth (red):** A sinusoidal curve oscillating between approximately -4 and 4.
* **Pre-update (light green dotted):** Starts around y=0 at x=-6, rises to a peak around y=2 at x=-3, then decreases to a trough around y=-1 at x=0, and rises again.
* **1 grad step (dark green dotted):** Starts around y=-3 at x=-6, rises to a peak around y=3 at x=-3, then decreases to a trough around y=-4 at x=0, and rises again.
* **10 grad steps (dark green dashed):** Closely follows the ground truth, indicating good adaptation.
* **Used for grad (purple triangles):** Located on the ground truth curve.
**Chart 2: MAML, K=10**
* **Ground Truth (red):** Similar sinusoidal curve as in Chart 1.
* **Pre-update (light green dotted):** Starts around y=0 at x=-6, rises to a peak around y=2 at x=-3, then decreases to a trough around y=-1 at x=0, and rises again.
* **1 grad step (dark green dotted):** Starts around y=-3 at x=-6, rises to a peak around y=3 at x=-3, then decreases to a trough around y=-4 at x=0, and rises again.
* **10 grad steps (dark green dashed):** Closely follows the ground truth, indicating good adaptation.
* **Used for grad (purple triangles):** Located on the ground truth curve.
**Chart 3: pretrained, K=5, step size=0.01**
* **Ground Truth (red):** Similar sinusoidal curve as in Chart 1.
* **Pre-update (light blue dotted):** Starts around y=0 at x=-6, rises to a peak around y=2 at x=-3, then decreases to a trough around y=-1 at x=0, and rises again.
* **1 grad step (dark blue dotted):** Starts around y=-1 at x=-6, rises to a peak around y=2 at x=-3, then decreases to a trough around y=-2 at x=0, and rises again.
* **10 grad steps (dark blue dashed):** Starts around y=-2 at x=-6, rises to a peak around y=3 at x=-3, then decreases to a trough around y=-3 at x=0, and rises again.
* **Used for grad (purple triangles):** Located on the ground truth curve.
**Chart 4: pretrained, K=10, step size=0.02**
* **Ground Truth (red):** Similar sinusoidal curve as in Chart 1.
* **Pre-update (light blue dotted):** Starts around y=0 at x=-6, rises to a peak around y=2 at x=-3, then decreases to a trough around y=-1 at x=0, and rises again.
* **1 grad step (dark blue dotted):** Starts around y=-1 at x=-6, rises to a peak around y=2 at x=-3, then decreases to a trough around y=-2 at x=0, and rises again.
* **10 grad steps (dark blue dashed):** Starts around y=-2 at x=-6, rises to a peak around y=3 at x=-3, then decreases to a trough around y=-3 at x=0, and rises again.
* **Used for grad (purple triangles):** Located on the ground truth curve.
### Key Observations
* In both MAML charts (K=5 and K=10), the "10 grad steps" line closely aligns with the "ground truth" line, indicating effective adaptation to the target function.
* In the pretrained charts, the "10 grad steps" line does not align as closely with the "ground truth" line as in the MAML charts, suggesting that MAML adapts more effectively with fewer updates.
* The "pre-update" lines show the initial state of the model before any adaptation.
* The purple triangles ("used for grad") mark the data points used for gradient calculation.
### Interpretation
The charts demonstrate the effectiveness of MAML in adapting to new tasks with a small number of gradient updates. The MAML models, with both K=5 and K=10, quickly converge to the "ground truth" function after just 10 gradient steps. In contrast, the pretrained models, even with different step sizes, do not adapt as effectively, suggesting that MAML is better suited for few-shot learning scenarios where rapid adaptation is crucial. The "pre-update" lines highlight the importance of a good initialization, while the "used for grad" markers indicate the data points that drive the adaptation process. The choice of K and step size influences the adaptation process, but MAML appears to be more robust in this comparison.