## Chart Type: Scatter Plot with Trajectories
### Overview
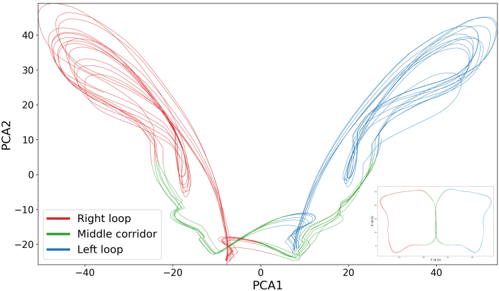
The image is a scatter plot displaying trajectories in a two-dimensional space defined by PCA1 and PCA2. Three distinct trajectories are plotted, each represented by a different color: red ("Right loop"), green ("Middle corridor"), and blue ("Left loop"). The plot shows the movement or evolution of data points within this PCA space, with each trajectory forming a loop-like structure. An inset plot in the bottom-right corner provides a simplified overview of the three trajectories.
### Components/Axes
* **X-axis (PCA1):** Ranges from approximately -40 to 40. Axis markers are present at -40, -20, 0, 20, and 40.
* **Y-axis (PCA2):** Ranges from approximately -20 to 40. Axis markers are present at -20, -10, 0, 10, 20, 30, and 40.
* **Legend:** Located in the bottom-left corner, it identifies the three trajectories:
* Red: "Right loop"
* Green: "Middle corridor"
* Blue: "Left loop"
* **Inset Plot:** Located in the bottom-right corner, it shows a simplified version of the three trajectories. The axes are not labeled in the inset plot.
### Detailed Analysis
* **Right loop (Red):**
* Trend: Starts near PCA1 = -25 and PCA2 = -15, loops upwards and to the left, reaching a maximum PCA2 value of approximately 40 at PCA1 = -30, then curves back down and towards the center, ending near PCA1 = -10 and PCA2 = -20.
* The red line forms multiple overlapping loops on the left side of the graph.
* **Middle corridor (Green):**
* Trend: Stays relatively close to the PCA1 axis (PCA2 values between -20 and 0), connecting the "Right loop" and "Left loop" trajectories. It forms a relatively straight path along the bottom of the graph.
* The green line is mostly concentrated between PCA1 values of -20 and 20.
* **Left loop (Blue):**
* Trend: Starts near PCA1 = 10 and PCA2 = -20, loops upwards and to the right, reaching a maximum PCA2 value of approximately 40 at PCA1 = 30, then curves back down and towards the center, ending near PCA1 = 25 and PCA2 = -15.
* The blue line forms multiple overlapping loops on the right side of the graph.
### Key Observations
* The "Right loop" and "Left loop" trajectories are roughly symmetrical about the PCA2 axis.
* The "Middle corridor" trajectory acts as a bridge between the two loops, suggesting a transition or connection between the states represented by the loops.
* The trajectories show complex, cyclical behavior within the PCA space.
* The inset plot provides a clear, simplified overview of the overall structure of the trajectories.
### Interpretation
The plot visualizes the dynamics of a system in a reduced-dimensional space (PCA1 and PCA2). The three trajectories ("Right loop", "Middle corridor", and "Left loop") likely represent different states or behaviors of the system. The cyclical nature of the loops suggests that the system oscillates between these states. The "Middle corridor" trajectory indicates a transition path between the "Right loop" and "Left loop" states. The symmetry between the "Right loop" and "Left loop" might indicate similar underlying processes or symmetrical conditions. The PCA analysis likely aims to reduce the dimensionality of the original data while preserving the key features that distinguish these three states. The plot is useful for understanding the overall dynamics and relationships between these states.