\n
## Scatter Plot: PCA Projection of Trajectories
### Overview
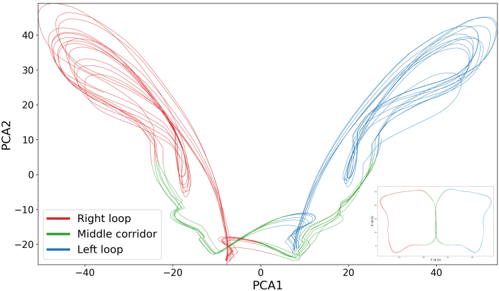
The image presents a scatter plot visualizing trajectories projected onto the first two Principal Components (PCA1 and PCA2). The plot displays three distinct trajectory groups, likely representing different behavioral states or paths. The trajectories are represented as colored lines, with a legend identifying each group. A small inset plot in the bottom-right corner shows representative shapes of the trajectories.
### Components/Axes
* **X-axis:** PCA1 (ranging approximately from -45 to 25)
* **Y-axis:** PCA2 (ranging approximately from -25 to 45)
* **Legend:** Located in the top-left corner, identifying three trajectory groups:
* Right loop (Red)
* Middle corridor (Green)
* Left loop (Blue)
* **Inset Plot:** Located in the bottom-right corner, showing representative shapes of the trajectories. The inset plot has axes labeled "Time" (x-axis) and a value ranging from 0 to 400 (y-axis).
### Detailed Analysis
The plot shows a clear separation of the three trajectory groups based on their PCA1 and PCA2 values.
* **Right Loop (Red):** This group exhibits a wide range of PCA2 values (approximately -10 to 45) and PCA1 values concentrated between -40 and -10. The lines generally curve upwards and to the left. The trajectories appear to originate near PCA1=-20, PCA2=-10 and extend upwards and to the left.
* **Middle Corridor (Green):** This group is tightly clustered around PCA1 values between -20 and 0, and PCA2 values between -15 and 0. The lines are relatively short and appear to form a narrow corridor. The trajectories appear to originate near PCA1=-10, PCA2=-5.
* **Left Loop (Blue):** This group shows a range of PCA2 values (approximately -20 to 30) and PCA1 values concentrated between 0 and 25. The lines generally curve downwards and to the right. The trajectories appear to originate near PCA1=0, PCA2=0 and extend downwards and to the right.
The inset plot shows two representative shapes: one for the right loop (red) and one for the left loop (blue). The shapes are roughly similar, suggesting a cyclical pattern. The x-axis of the inset plot is labeled "Time" and ranges from 0 to 400. The y-axis is not labeled, but the values range from approximately -10 to 10.
### Key Observations
* The three trajectory groups are well-separated in the PCA space, suggesting distinct underlying behavioral patterns.
* The "Middle Corridor" trajectories are the most constrained, while the "Right Loop" and "Left Loop" trajectories exhibit more variability.
* The inset plot confirms the cyclical nature of the "Right Loop" and "Left Loop" trajectories.
* The trajectories all appear to converge near the origin (PCA1 ≈ 0, PCA2 ≈ 0).
### Interpretation
This PCA plot likely represents the dimensionality reduction of complex trajectory data, potentially from animal movement, robotic paths, or other time-series data. The three trajectory groups suggest three distinct behavioral states or modes of operation. The separation in PCA space indicates that these states are relatively independent. The convergence of trajectories near the origin could represent a transition point between these states or a common starting/ending point. The inset plot provides a visual confirmation of the cyclical nature of the "Right Loop" and "Left Loop" trajectories, suggesting repetitive movements or patterns. The "Middle Corridor" may represent a more direct or efficient path. Further analysis would be needed to determine the specific meaning of each trajectory group in the context of the original data. The use of PCA suggests an attempt to identify the most important variables driving the observed differences in trajectories.