## Scatter Plot: Principal Component Analysis (PCA) of Spatial Layout
### Overview
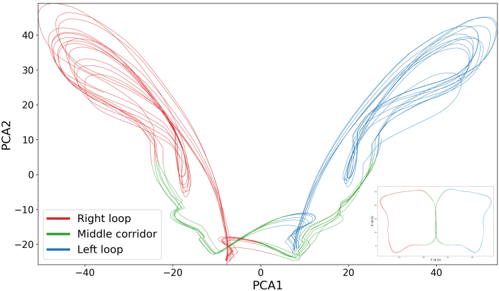
The image is a 2D scatter plot visualizing the results of a Principal Component Analysis (PCA) applied to spatial data. Three distinct trajectories are plotted: "Right loop" (red), "Middle corridor" (green), and "Left loop" (blue). An inset diagram in the bottom-right corner provides a spatial reference for the layout.
### Components/Axes
- **X-axis (PCA1)**: Ranges from -40 to 40.
- **Y-axis (PCA2)**: Ranges from -20 to 40.
- **Legend**: Located in the bottom-right corner, mapping colors to labels:
- Red: Right loop
- Green: Middle corridor
- Blue: Left loop
- **Inset Diagram**: A simplified 2D layout of the spatial structure, with the same color coding as the legend.
### Detailed Analysis
1. **Right Loop (Red)**:
- Starts at approximately (-40, 40) and spirals downward in a clockwise direction.
- Ends near (-20, -20), forming a loop with moderate curvature.
- Trajectory shows high variability in PCA2 values, suggesting complex motion.
2. **Middle Corridor (Green)**:
- A nearly straight line connecting the right and left loops.
- Begins near (-20, -20) and extends to (20, -20), with minimal deviation.
- Acts as a central pathway between the two loops.
3. **Left Loop (Blue)**:
- Mirrors the right loop but on the opposite side of the PCA1 axis.
- Starts at (40, 40) and spirals counterclockwise, ending near (20, -20).
- Symmetrical to the right loop in shape and scale.
4. **Inset Diagram**:
- Shows a top-down view of the spatial layout.
- Right loop (red) and left loop (blue) are positioned symmetrically around the middle corridor (green).
- Confirms the spatial relationship between the loops and corridor.
### Key Observations
- **Symmetry**: The right and left loops are mirror images across the PCA1 axis, indicating balanced structural properties.
- **Central Connector**: The middle corridor serves as a direct link between the two loops, suggesting a critical pathway.
- **Loop Complexity**: Both loops exhibit non-linear trajectories, implying dynamic or cyclical behavior in the original data.
- **PCA Dimensionality**: The separation of loops along PCA1 and PCA2 axes highlights distinct principal components in the data.
### Interpretation
This PCA visualization demonstrates how spatial data can be reduced to two principal components while preserving key structural relationships. The symmetry between the right and left loops suggests similar processes or features on either side of the layout. The middle corridor’s linear trajectory indicates it may represent a stable or central feature (e.g., a main pathway or axis of symmetry). The loops’ spiraling paths could reflect rotational or iterative behaviors in the original high-dimensional data.
The inset diagram reinforces the spatial grounding, confirming that PCA1 and PCA2 axes capture the primary axes of variation in the layout. The absence of overlapping trajectories between the loops and corridor suggests distinct functional roles for each component.
**Note**: Exact numerical values for data points are not provided in the image; trends and positions are approximated based on visual inspection.