## Line Chart: I-Don't-Know Rate Comparison for Mistral-7B-v0.1 and Mistral-7B-v0.3
### Overview
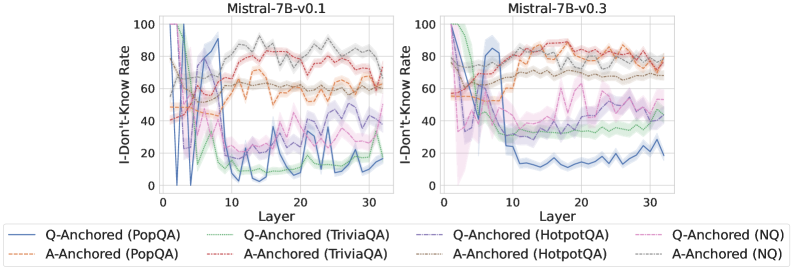
The image presents two line charts comparing the "I-Don't-Know Rate" across different layers (0-32) of the Mistral-7B-v0.1 and Mistral-7B-v0.3 models. Each chart displays multiple data series, representing different question-answering datasets (PopQA, TriviaQA, HotpotQA, and NQ) anchored by either the question (Q-Anchored) or the answer (A-Anchored). The charts aim to illustrate how the model's uncertainty varies across layers and datasets for the two model versions.
### Components/Axes
* **Titles:**
* Left Chart: "Mistral-7B-v0.1"
* Right Chart: "Mistral-7B-v0.3"
* **Y-Axis:**
* Label: "I-Don't-Know Rate"
* Scale: 0 to 100, with tick marks at 0, 20, 40, 60, 80, and 100.
* **X-Axis:**
* Label: "Layer"
* Scale: 0 to approximately 32, with tick marks every 5 units (0, 10, 20, 30).
* **Legend:** Located at the bottom of the image, it identifies each data series by color and line style:
* Blue solid line: Q-Anchored (PopQA)
* Brown dashed line: A-Anchored (PopQA)
* Green dotted line: Q-Anchored (TriviaQA)
* Orange dash-dot line: A-Anchored (TriviaQA)
* Red dashed line: Q-Anchored (HotpotQA)
* Gray dotted line: A-Anchored (HotpotQA)
* Purple dash-dot line: Q-Anchored (NQ)
* Black dashed line: A-Anchored (NQ)
### Detailed Analysis
**Left Chart: Mistral-7B-v0.1**
* **Q-Anchored (PopQA) (Blue solid line):** Starts at 100, drops sharply to near 0 by layer 5, then fluctuates between approximately 5 and 20 for the remaining layers.
* **A-Anchored (PopQA) (Brown dashed line):** Starts around 50, rises to approximately 60-70, and remains relatively stable with minor fluctuations.
* **Q-Anchored (TriviaQA) (Green dotted line):** Starts at 100, drops sharply to approximately 10-20 by layer 10, then fluctuates between 10 and 30.
* **A-Anchored (TriviaQA) (Orange dash-dot line):** Starts around 50, rises to approximately 70-80, and remains relatively stable with minor fluctuations.
* **Q-Anchored (HotpotQA) (Red dashed line):** Starts around 50, rises to approximately 70-80, and remains relatively stable with minor fluctuations.
* **A-Anchored (HotpotQA) (Gray dotted line):** Starts around 60, remains relatively stable with minor fluctuations between 60 and 80.
* **Q-Anchored (NQ) (Purple dash-dot line):** Starts around 40, fluctuates significantly between 10 and 40 across the layers.
* **A-Anchored (NQ) (Black dashed line):** Starts around 60, remains relatively stable with minor fluctuations between 60 and 80.
**Right Chart: Mistral-7B-v0.3**
* **Q-Anchored (PopQA) (Blue solid line):** Starts at 100, drops sharply to approximately 10-20 by layer 10, then remains relatively stable with minor fluctuations.
* **A-Anchored (PopQA) (Brown dashed line):** Starts around 70, remains relatively stable with minor fluctuations between 60 and 80.
* **Q-Anchored (TriviaQA) (Green dotted line):** Starts at 100, drops sharply to approximately 20-30 by layer 5, then fluctuates between 20 and 40.
* **A-Anchored (TriviaQA) (Orange dash-dot line):** Starts around 60, rises to approximately 70-80, and remains relatively stable with minor fluctuations.
* **Q-Anchored (HotpotQA) (Red dashed line):** Starts around 60, rises to approximately 80-90, and remains relatively stable with minor fluctuations.
* **A-Anchored (HotpotQA) (Gray dotted line):** Starts around 80, remains relatively stable with minor fluctuations between 70 and 90.
* **Q-Anchored (NQ) (Purple dash-dot line):** Starts around 60, fluctuates significantly between 20 and 60 across the layers.
* **A-Anchored (NQ) (Black dashed line):** Starts around 80, remains relatively stable with minor fluctuations between 70 and 90.
### Key Observations
* For both models, the "Q-Anchored (PopQA)" series shows a significant drop in the "I-Don't-Know Rate" after the initial layers.
* The "A-Anchored" series generally exhibit more stable "I-Don't-Know Rates" compared to the "Q-Anchored" series.
* The Mistral-7B-v0.3 model appears to have a generally lower "I-Don't-Know Rate" for the "Q-Anchored (PopQA)" series after the initial layers compared to Mistral-7B-v0.1.
* The shaded regions around each line indicate the confidence interval or standard deviation, showing the variability in the "I-Don't-Know Rate" across different runs or samples.
### Interpretation
The charts provide insights into how the Mistral-7B models handle uncertainty across different layers and question-answering datasets. The "I-Don't-Know Rate" can be interpreted as a measure of the model's confidence in its predictions. The observed trends suggest that:
* **Question Anchoring vs. Answer Anchoring:** Anchoring the data on the answer generally leads to more stable and often higher "I-Don't-Know Rates," possibly indicating that the model is more aware of its uncertainty when the answer is provided.
* **Dataset Sensitivity:** The models exhibit varying levels of uncertainty depending on the dataset. PopQA, in particular, shows a significant reduction in the "I-Don't-Know Rate" for Q-Anchored data after the initial layers, suggesting that the model becomes more confident in its predictions for this dataset as it processes more layers.
* **Model Version Comparison:** The Mistral-7B-v0.3 model appears to have improved in terms of reducing uncertainty for the Q-Anchored (PopQA) dataset, as indicated by the lower "I-Don't-Know Rate" after the initial layers.
* **Layer-wise Behavior:** The fluctuations in the "I-Don't-Know Rate" across different layers suggest that the model's uncertainty changes as it processes the input through different layers of its neural network architecture.
The data suggests that the model's confidence and uncertainty are influenced by the anchoring method (question vs. answer), the specific question-answering dataset, and the depth of the model (layer number). The comparison between the two model versions highlights potential improvements in uncertainty handling in the newer version (v0.3).