TECHNICAL ASSET FINGERPRINT
c2bcc129008b074dcc511ded
Click to view fullscreen
Press ESC or click to close
FOUND IN PAPERS
EXPERT: healer-alpha-free VERSION 1
RUNTIME: free/openrouter/healer-alpha
INTEL_VERIFIED
## Line Chart: EGA Performance Under Perturbed Conditions
### Overview
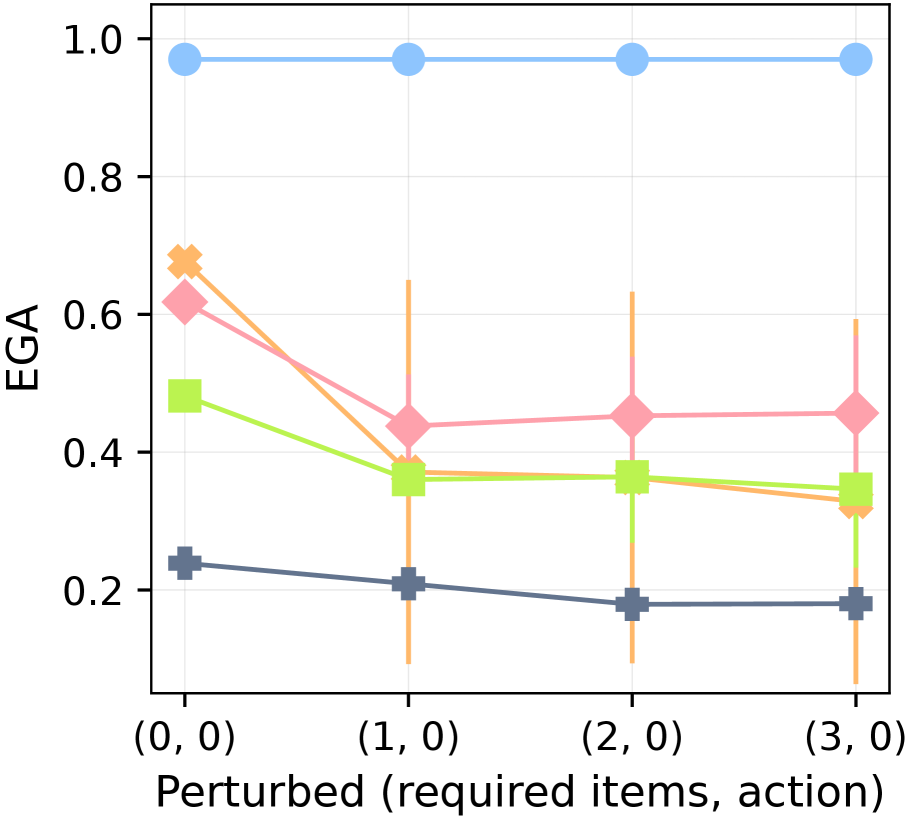
The image displays a line chart with error bars, plotting the performance metric "EGA" against four distinct perturbed conditions. The chart compares four different model configurations, showing how their performance changes as more components (subgoals, actions, items) are removed from the system.
### Components/Axes
* **Chart Type:** Line chart with vertical error bars.
* **Y-Axis:**
* **Label:** "EGA"
* **Scale:** Linear, ranging from 0.0 to 1.0.
* **Major Ticks:** 0.0, 0.2, 0.4, 0.6, 0.8, 1.0.
* **X-Axis:**
* **Label:** "Perturbed (required items, action)"
* **Categories (from left to right):** `(0, 0)`, `(1, 0)`, `(2, 0)`, `(3, 0)`. These tuples likely represent the number of required items perturbed (first number) and whether the action is perturbed (second number, 0 for no).
* **Legend:**
* **Position:** Top-right corner of the plot area.
* **Entries (from top to bottom in legend):**
1. **Label:** "Ours (Oracle)"
* **Color:** Light blue.
* **Marker:** Circle.
2. **Label:** "Ours (Oracle, No-Subgoal)"
* **Color:** Pink.
* **Marker:** Diamond.
3. **Label:** "Ours (Oracle, No-Subgoal, No-Action)"
* **Color:** Light green.
* **Marker:** Square.
4. **Label:** "Ours (Oracle, No-Subgoal, No-Action, No-Item)"
* **Color:** Orange.
* **Marker:** X (cross).
* **Note:** A fifth data series (dark blue line with plus markers) is present in the chart but is **not listed in the legend**. Its label is unknown.
### Detailed Analysis
**Data Series and Trends:**
1. **Ours (Oracle) - Light Blue Line, Circle Markers:**
* **Trend:** Perfectly flat, horizontal line at the top of the chart.
* **Data Points (Approximate):**
* `(0, 0)`: EGA ≈ 0.97
* `(1, 0)`: EGA ≈ 0.97
* `(2, 0)`: EGA ≈ 0.97
* `(3, 0)`: EGA ≈ 0.97
* **Error Bars:** Not visible, suggesting negligible or zero variance.
2. **Ours (Oracle, No-Subgoal) - Pink Line, Diamond Markers:**
* **Trend:** Sharp initial decline from `(0,0)` to `(1,0)`, then stabilizes.
* **Data Points (Approximate):**
* `(0, 0)`: EGA ≈ 0.61
* `(1, 0)`: EGA ≈ 0.44
* `(2, 0)`: EGA ≈ 0.45
* `(3, 0)`: EGA ≈ 0.45
* **Error Bars:** Visible vertical lines at `(1,0)`, `(2,0)`, and `(3,0)`. The bar at `(1,0)` is the longest, spanning roughly from EGA 0.25 to 0.65.
3. **Ours (Oracle, No-Subgoal, No-Action) - Light Green Line, Square Markers:**
* **Trend:** Moderate decline from `(0,0)` to `(1,0)`, then a very slight, gradual decline.
* **Data Points (Approximate):**
* `(0, 0)`: EGA ≈ 0.48
* `(1, 0)`: EGA ≈ 0.37
* `(2, 0)`: EGA ≈ 0.36
* `(3, 0)`: EGA ≈ 0.35
* **Error Bars:** Visible at `(1,0)`, `(2,0)`, and `(3,0)`, generally shorter than those for the pink series.
4. **Ours (Oracle, No-Subgoal, No-Action, No-Item) - Orange Line, X Markers:**
* **Trend:** Steep, continuous decline across all perturbation levels.
* **Data Points (Approximate):**
* `(0, 0)`: EGA ≈ 0.68 (This is an outlier, being higher than the pink and green series at this point).
* `(1, 0)`: EGA ≈ 0.36
* `(2, 0)`: EGA ≈ 0.36
* `(3, 0)`: EGA ≈ 0.32
* **Error Bars:** Very prominent, especially at `(1,0)` where the bar spans from near 0.1 to over 0.6. Bars remain large at `(2,0)` and `(3,0)`.
5. **Unlabeled Series - Dark Blue Line, Plus Markers:**
* **Trend:** Slow, steady decline.
* **Data Points (Approximate):**
* `(0, 0)`: EGA ≈ 0.23
* `(1, 0)`: EGA ≈ 0.21
* `(2, 0)`: EGA ≈ 0.18
* `(3, 0)`: EGA ≈ 0.18
* **Error Bars:** Not visible.
### Key Observations
1. **Performance Hierarchy:** The "Oracle" model (light blue) maintains near-perfect performance (~0.97 EGA) regardless of perturbation, serving as an upper-bound baseline.
2. **Impact of Removing Components:** Removing subgoals (pink) causes a significant initial performance drop. Further removing actions (green) lowers performance more. Removing items as well (orange) leads to the most severe decline, especially at higher perturbation levels.
3. **Anomaly at (0,0):** The orange series ("No-Item") starts at a higher EGA (~0.68) than both the pink (~0.61) and green (~0.48) series at the `(0,0)` perturbation point. This is counter-intuitive given its label suggests it has the most components removed.
4. **Error Bar Magnitude:** The orange series exhibits the largest error bars, indicating high variance or instability in its performance, particularly when perturbations are introduced (`(1,0)` onwards).
5. **Unidentified Baseline:** The dark blue line represents a consistently low-performing model or baseline whose identity is not provided in the legend.
### Interpretation
This chart demonstrates the **critical importance of subgoals, actions, and items** for robust performance in the evaluated task. The "Oracle" model's flat line shows that with full information, performance is unaffected by the tested perturbations.
The progressive decline of the other series illustrates a **cascading failure effect**: removing subgoals first hurts performance significantly. Removing actions on top of that degrades it further. The final removal of items leads to the worst performance and highest instability (large error bars), suggesting the system becomes highly sensitive and unreliable without this foundational component.
The anomaly at `(0,0)` for the "No-Item" model is puzzling. It may indicate that in the *unperturbed* state, the absence of item requirements somehow simplifies the task for that specific configuration, but this advantage completely vanishes—and reverses—once any perturbation is introduced. This highlights that the model's architecture is not robust.
In summary, the data argues for the necessity of a complete, hierarchical structure (items → actions → subgoals) to achieve both high performance and resilience to perturbations in the environment. The large error bars on the most stripped-down model (orange) further emphasize that removing core components doesn't just lower average performance; it makes outcomes unpredictable.
DECODING INTELLIGENCE...