\n
## Line Chart: Accuracy vs. Number of Operations for Different 'n' Values
### Overview
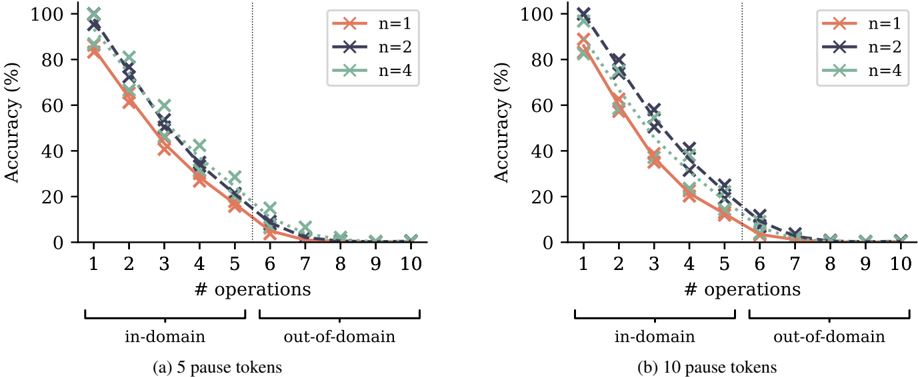
The image presents two line charts, side-by-side, illustrating the relationship between accuracy (in percentage) and the number of operations, for different values of 'n' (1, 2, and 4). Each chart is divided into two regions: "in-domain" and "out-of-domain", demarcated by a vertical dashed line. The charts compare performance under two different pause token conditions: (a) 5 pause tokens and (b) 10 pause tokens.
### Components/Axes
* **X-axis:** "# operations" - ranging from 1 to 10, with integer markers.
* **Y-axis:** "Accuracy (%)" - ranging from 0 to 100, with markers at 0, 20, 40, 60, 80, and 100.
* **Legend:** Located in the top-right corner of each chart.
* n=1 (represented by a red line with 'x' markers)
* n=2 (represented by a purple line with '+' markers)
* n=4 (represented by a green line with '*' markers)
* **Vertical Dashed Line:** Separates the "in-domain" and "out-of-domain" regions.
* **Chart Titles:**
* (a) 5 pause tokens
* (b) 10 pause tokens
* **Domain Labels:** "in-domain" and "out-of-domain" are labeled below the x-axis.
### Detailed Analysis or Content Details
**Chart (a) - 5 pause tokens:**
* **n=1 (Red):** Starts at approximately 100% accuracy at operation 1. Decreases steadily within the in-domain (operations 1-4), reaching approximately 10% accuracy at operation 4. Continues to decrease in the out-of-domain (operations 5-10), leveling off around 5% accuracy at operation 10.
* **n=2 (Purple):** Starts at approximately 98% accuracy at operation 1. Decreases more rapidly than n=1 within the in-domain, reaching approximately 20% accuracy at operation 4. Decreases further in the out-of-domain, leveling off around 5% accuracy at operation 10.
* **n=4 (Green):** Starts at approximately 98% accuracy at operation 1. Decreases rapidly within the in-domain, reaching approximately 40% accuracy at operation 4. Decreases sharply in the out-of-domain, leveling off around 5% accuracy at operation 10.
**Chart (b) - 10 pause tokens:**
* **n=1 (Red):** Starts at approximately 100% accuracy at operation 1. Decreases steadily within the in-domain (operations 1-4), reaching approximately 20% accuracy at operation 4. Continues to decrease in the out-of-domain (operations 5-10), leveling off around 5% accuracy at operation 10.
* **n=2 (Purple):** Starts at approximately 98% accuracy at operation 1. Decreases more rapidly than n=1 within the in-domain, reaching approximately 30% accuracy at operation 4. Decreases further in the out-of-domain, leveling off around 5% accuracy at operation 10.
* **n=4 (Green):** Starts at approximately 98% accuracy at operation 1. Decreases rapidly within the in-domain, reaching approximately 50% accuracy at operation 4. Decreases sharply in the out-of-domain, leveling off around 5% accuracy at operation 10.
### Key Observations
* Accuracy decreases as the number of operations increases for all values of 'n' in both charts.
* The rate of accuracy decrease is more pronounced in the out-of-domain region compared to the in-domain region.
* Higher values of 'n' (2 and 4) exhibit a faster decline in accuracy, especially within the in-domain region.
* All lines converge to approximately 5% accuracy at operation 10, regardless of the value of 'n' or the number of pause tokens.
* Increasing the number of pause tokens (from 5 to 10) generally leads to a slightly slower initial decline in accuracy, but the overall trend remains the same.
### Interpretation
The data suggests that as the number of operations increases, the accuracy of the system degrades. This degradation is more significant when operating outside of the "in-domain" conditions. The parameter 'n' appears to influence the rate of accuracy decline, with larger values of 'n' leading to a faster decrease. The convergence of all lines to a similar low accuracy level at higher operation counts indicates a potential limit to the system's performance, regardless of the initial parameter settings.
The difference between the two charts (5 vs. 10 pause tokens) suggests that increasing the pause duration can provide a slight buffer against initial accuracy loss, but does not fundamentally alter the overall trend of decreasing accuracy with increasing operations. This could indicate that the system is sensitive to the complexity of the operations performed, and that longer pauses may allow for some degree of recovery or stabilization, but ultimately cannot prevent the eventual decline in performance. The "in-domain" vs "out-of-domain" distinction highlights the importance of operating within the system's intended use case for optimal accuracy.