TECHNICAL ASSET FINGERPRINT
c2d549daafd5ede950cfc0a5
Click to view fullscreen
Press ESC or click to close
FOUND IN PAPERS
EXPERT: healer-alpha-free VERSION 1
RUNTIME: free/openrouter/healer-alpha
INTEL_VERIFIED
## Heatmap: Token Attribution for Mathematical Expressions
### Overview
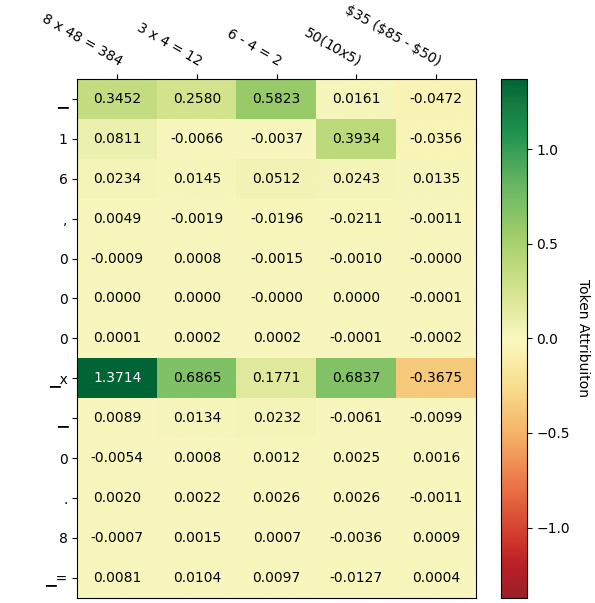
The image is a heatmap visualization displaying "Token Attribution" scores. It maps the attribution (importance or contribution) of individual tokens (rows) to specific mathematical expressions (columns). The color intensity represents the magnitude and direction of attribution, with a scale ranging from -1.0 (dark red) to 1.0 (dark green). The grid contains 13 rows and 5 columns of numerical data.
### Components/Axes
* **Column Headers (Top):** Five mathematical expressions serve as categories:
1. `8 x 48 = 384`
2. `3 x 4 = 12`
3. `6 - 4 = 2`
4. `50(10x5)`
5. `$35 ($85 - $50)`
* **Row Labels (Left):** Thirteen individual tokens or symbols, listed from top to bottom:
`—`, `1`, `6`, `,`, `0`, `0`, `0`, `x`, `—`, `0`, `.`, `8`, `_=`
* **Color Scale/Legend (Right):** A vertical bar labeled "Token Attribution" with a gradient from dark red (-1.0) through yellow (0.0) to dark green (1.0). Tick marks are at -1.0, -0.5, 0.0, 0.5, and 1.0.
### Detailed Analysis
The following table reconstructs the heatmap's data. Values are approximate, read to four decimal places. The color description is based on the legend.
| Row Token | `8 x 48 = 384` | `3 x 4 = 12` | `6 - 4 = 2` | `50(10x5)` | `$35 ($85 - $50)` |
| :--- | :--- | :--- | :--- | :--- | :--- |
| **`—`** | 0.3452 (Light Green) | 0.2580 (Light Green) | **0.5823 (Medium Green)** | 0.0161 (Very Light Yellow) | -0.0472 (Very Light Orange) |
| **`1`** | 0.0811 (Very Light Green) | -0.0066 (Very Light Yellow) | -0.0037 (Very Light Yellow) | **0.3934 (Light Green)** | -0.0356 (Very Light Orange) |
| **`6`** | 0.0234 (Very Light Green) | 0.0145 (Very Light Green) | 0.0512 (Very Light Green) | 0.0243 (Very Light Green) | 0.0135 (Very Light Green) |
| **`,`** | 0.0049 (Very Light Yellow) | -0.0019 (Very Light Yellow) | -0.0196 (Very Light Orange) | -0.0211 (Very Light Orange) | -0.0011 (Very Light Yellow) |
| **`0`** | -0.0009 (Very Light Yellow) | 0.0008 (Very Light Yellow) | -0.0015 (Very Light Yellow) | -0.0010 (Very Light Yellow) | -0.0000 (Yellow) |
| **`0`** | 0.0000 (Yellow) | 0.0000 (Yellow) | -0.0000 (Yellow) | 0.0000 (Yellow) | -0.0001 (Very Light Yellow) |
| **`0`** | 0.0001 (Very Light Yellow) | 0.0002 (Very Light Yellow) | 0.0002 (Very Light Yellow) | -0.0001 (Very Light Yellow) | -0.0002 (Very Light Yellow) |
| **`x`** | **1.3714 (Dark Green, >1.0)** | **0.6865 (Green)** | 0.1771 (Light Green) | **0.6837 (Green)** | **-0.3675 (Orange)** |
| **`—`** | 0.0089 (Very Light Yellow) | 0.0134 (Very Light Yellow) | 0.0232 (Very Light Yellow) | -0.0061 (Very Light Yellow) | -0.0099 (Very Light Yellow) |
| **`0`** | -0.0054 (Very Light Yellow) | 0.0008 (Very Light Yellow) | 0.0012 (Very Light Yellow) | 0.0025 (Very Light Yellow) | 0.0016 (Very Light Yellow) |
| **`.`** | 0.0020 (Very Light Yellow) | 0.0006 (Very Light Yellow) | 0.0026 (Very Light Yellow) | 0.0026 (Very Light Yellow) | -0.0011 (Very Light Yellow) |
| **`8`** | -0.0007 (Very Light Yellow) | 0.0015 (Very Light Yellow) | 0.0007 (Very Light Yellow) | -0.0036 (Very Light Yellow) | 0.0009 (Very Light Yellow) |
| **`_=`** | 0.0081 (Very Light Yellow) | 0.0104 (Very Light Yellow) | 0.0097 (Very Light Yellow) | -0.0127 (Very Light Yellow) | 0.0004 (Very Light Yellow) |
### Key Observations
1. **Dominant Row:** The token **`x`** (8th row) shows the highest absolute attribution values across the board. It has a strongly positive attribution for `8 x 48 = 384` (1.3714, exceeding the scale), `3 x 4 = 12` (0.6865), and `50(10x5)` (0.6837), but a notably negative attribution for `$35 ($85 - $50)` (-0.3675).
2. **Significant Column Patterns:**
* The expression `8 x 48 = 384` receives its highest positive attribution from the `x` token and a moderately high one from the first `—` token.
* The expression `50(10x5)` has its highest positive attribution from the `x` token and a significant one from the `1` token.
* The expression `$35 ($85 - $50)` is unique in having its most significant attribution be *negative*, coming from the `x` token.
3. **Low-Attribution Tokens:** Most tokens (especially the repeated `0`s, `,`, `.`, `8`, `_=`, and the second `—`) have attribution scores very close to zero (|value| < 0.03) for all expressions, indicating minimal influence.
4. **Color-Value Consistency:** The color of each cell aligns with the legend. High positive values are green, high negative values are orange/red, and values near zero are pale yellow.
### Interpretation
This heatmap likely visualizes the output of an interpretability technique (like attention or integrated gradients) applied to a model processing mathematical expressions. It answers: "How important was each input token for the model's final representation or prediction for each expression?"
* **The `x` Token is Pivotal:** The token `x` is critically important for expressions involving multiplication (`8 x 48`, `3 x 4`, `10x5`). Its high positive attribution suggests the model heavily relies on this symbol to identify and process multiplicative relationships. Conversely, its negative attribution for the purely subtractive/monetary expression `$35 ($85 - $50)` suggests the presence of `x` might be a distracting or counter-indicative feature for that specific context.
* **Context-Specific Importance:** The attribution of the `1` token is high only for `50(10x5)`, likely because the digit '1' is a key component of the number '10' within that expression. Similarly, the first `—` token (which could represent a dash or minus sign) has its highest attribution for `6 - 4 = 2`, aligning with its syntactic role.
* **Noise vs. Signal:** The vast majority of tokens have near-zero attribution, demonstrating that the model's focus is highly selective. It assigns importance to a small, semantically relevant subset of the input for each task.
* **Anomaly:** The value 1.3714 for (`x`, `8 x 48 = 384`) exceeds the defined color scale maximum of 1.0, resulting in a saturated dark green. This indicates an exceptionally strong positive attribution, possibly the most significant single data point in the analysis.
In summary, the heatmap provides a granular, quantitative view of how a model "attends to" or "attributes importance" to different parts of mathematical statements, revealing that its understanding is heavily anchored on operational symbols like `x` and contextually relevant digits and signs.
DECODING INTELLIGENCE...