## Heatmap: Token Attribution Analysis
### Overview
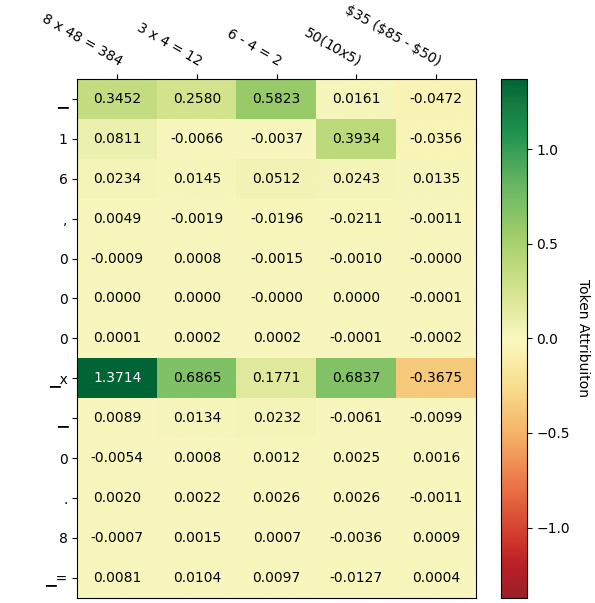
The image is a heatmap visualizing token attribution values across multiple categories. The data is organized in a grid with rows and columns labeled with mathematical expressions, numerical ranges, and currency values. A color scale on the right maps values from -1.0 (red) to 1.0 (green), with yellow representing near-zero values. The heatmap contains numerical values in each cell, indicating the magnitude and direction of token attribution.
---
### Components/Axes
#### Row Labels (Left):
- **—** (Row 1)
- **1** (Row 2)
- **6** (Row 3)
- **x** (Row 4)
- **—** (Row 5)
- **—** (Row 6)
- **8** (Row 7)
- **—** (Row 8)
- **=** (Row 9)
#### Column Labels (Top):
- **8 x 48 = 384** (Column 1)
- **3 x 4 = 12** (Column 2)
- **6 - 4 = 2** (Column 3)
- **50(10x5)** (Column 4)
- **$35 ($85 - $50)** (Column 5)
#### Legend (Right):
- **Color Scale**:
- **Green** (positive values, 0.0–1.0)
- **Yellow** (near-zero values, -0.5 to 0.5)
- **Red** (negative values, -1.0 to -0.5)
---
### Detailed Analysis
#### Row 1 (—):
- **8 x 48 = 384**: 0.3452
- **3 x 4 = 12**: 0.2580
- **6 - 4 = 2**: 0.5823
- **50(10x5)**: 0.0161
- **$35 ($85 - $50)**: -0.0472
#### Row 2 (1):
- **8 x 48 = 384**: 0.0811
- **3 x 4 = 12**: -0.0066
- **6 - 4 = 2**: -0.0037
- **50(10x5)**: 0.3934
- **$35 ($85 - $50)**: -0.0356
#### Row 3 (6):
- **8 x 48 = 384**: 0.0234
- **3 x 4 = 12**: 0.0145
- **6 - 4 = 2**: 0.0512
- **50(10x5)**: 0.0243
- **$35 ($85 - $50)**: 0.0135
#### Row 4 (x):
- **8 x 48 = 384**: 1.3714
- **3 x 4 = 12**: 0.6865
- **6 - 4 = 2**: 0.1771
- **50(10x5)**: 0.6837
- **$35 ($85 - $50)**: -0.3675
#### Row 5 (—):
- **8 x 48 = 384**: -0.0009
- **3 x 4 = 12**: -0.0009
- **6 - 4 = 2**: -0.0016
- **50(10x5)**: -0.0211
- **$35 ($85 - $50)**: -0.0011
#### Row 6 (—):
- **8 x 48 = 384**: 0.0000
- **3 x 4 = 12**: 0.0000
- **6 - 4 = 2**: -0.0000
- **50(10x5)**: 0.0000
- **$35 ($85 - $50)**: -0.0001
#### Row 7 (8):
- **8 x 48 = 384**: 0.0001
- **3 x 4 = 12**: 0.0002
- **6 - 4 = 2**: 0.0002
- **50(10x5)**: -0.0001
- **$35 ($85 - $50)**: -0.0002
#### Row 8 (—):
- **8 x 48 = 384**: 0.0009
- **3 x 4 = 12**: 0.0013
- **6 - 4 = 2**: 0.0023
- **50(10x5)**: -0.0061
- **$35 ($85 - $50)**: -0.0099
#### Row 9 (=):
- **8 x 48 = 384**: -0.0005
- **3 x 4 = 12**: 0.0008
- **6 - 4 = 2**: 0.0012
- **50(10x5)**: 0.0025
- **$35 ($85 - $50)**: 0.0016
---
### Key Observations
1. **Highest Positive Value**: 1.3714 in Row 4 (x) under "8 x 48 = 384".
2. **Highest Negative Value**: -0.3675 in Row 4 (x) under "$35 ($85 - $50)".
3. **Zeros in Middle Rows**: Rows 5–6 (—) show near-zero values, indicating minimal attribution.
4. **Mixed Trends**: Row 4 (x) has both extreme positive and negative values, suggesting strong opposing relationships.
5. **Small Magnitudes**: Most values are below 0.1 in absolute terms, except for Row 4.
---
### Interpretation
The heatmap reveals that token attribution varies significantly across categories. The "x" row (Row 4) exhibits the strongest attribution, with a high positive value (1.3714) for "8 x 48 = 384" and a notable negative value (-0.3675) for "$35 ($85 - $50)". This suggests a critical relationship between the "x" category and the mathematical expression "8 x 48 = 384", while the currency-based category "$35 ($85 - $50)" shows a moderate negative attribution.
The middle rows (Rows 5–6) with near-zero values indicate minimal or no attribution, possibly reflecting neutral or irrelevant factors. The color scale confirms that positive values (green) and negative values (red) are distributed unevenly, with the "x" row being the most dynamic. The data may represent a model's sensitivity to specific inputs, where "x" acts as a key variable influencing outcomes. The presence of both high positive and negative values in Row 4 highlights potential contradictions or trade-offs in the system being analyzed.