## Heatmaps: Digit Distribution Before and After GRPO
### Overview
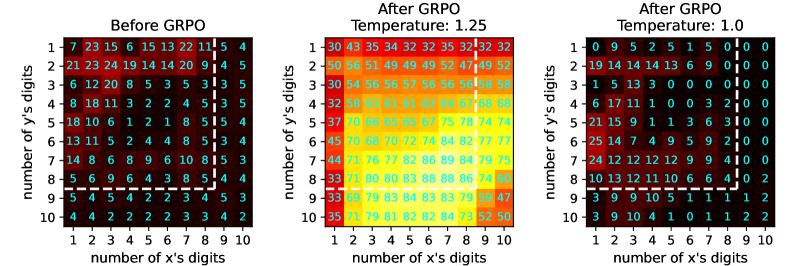
This image presents three heatmaps illustrating the distribution of digits in 'x' and 'y' before and after applying a process called "GRPO" with varying temperature parameters. The heatmaps display the frequency of digit pairs, where the x-axis represents the number of digits in 'x', and the y-axis represents the number of digits in 'y'. The color intensity indicates the frequency of occurrence, with warmer colors (red, orange, yellow) representing higher frequencies and cooler colors (green, blue) representing lower frequencies.
### Components/Axes
Each heatmap shares the following components:
* **X-axis:** "number of x's digits", ranging from 1 to 10.
* **Y-axis:** "number of y's digits", ranging from 1 to 10.
* **Color Scale/Legend:** Located on the right side of each heatmap. The scale ranges from blue (low frequency, approximately 0) to yellow/red (high frequency, approximately 88).
* **Titles:**
* "Before GRPO" (left heatmap)
* "After GRPO Temperature: 1.25" (center heatmap)
* "After GRPO Temperature: 1.0" (right heatmap)
### Detailed Analysis or Content Details
**1. Before GRPO:**
* The heatmap shows a relatively even distribution of digit pairs, with a slight concentration in the lower-left corner (small digit counts for both x and y).
* The highest values (dark red) are around (2,2) with a value of approximately 24, (3,2) with a value of approximately 20, and (2,3) with a value of approximately 20.
* The lowest values (dark blue) are concentrated in the upper-right corner, with values around 1-4.
**2. After GRPO - Temperature: 1.25:**
* The distribution is significantly different from the "Before GRPO" heatmap. There's a strong concentration of higher frequencies in the central region of the heatmap (digits 5-9 for both x and y).
* The highest value (bright red) is at (8,8) with a value of approximately 89.
* The lowest values (dark blue) are in the lower-left corner, with values around 30-35.
* A clear diagonal trend is visible, indicating a higher frequency of digit pairs where the number of digits in 'x' and 'y' are similar.
**3. After GRPO - Temperature: 1.0:**
* This heatmap shows a distribution that is more concentrated than the "Before GRPO" heatmap, but less concentrated than the "Temperature: 1.25" heatmap.
* The highest value (bright red) is at (7,7) with a value of approximately 74.
* The lowest values (dark blue) are in the upper-left corner, with values around 0-1.
* A diagonal trend is also visible, but less pronounced than in the "Temperature: 1.25" heatmap.
### Key Observations
* The GRPO process, regardless of temperature, shifts the distribution of digit pairs towards higher digit counts.
* Increasing the GRPO temperature (from 1.0 to 1.25) leads to a more concentrated distribution, with a stronger diagonal trend.
* The "Before GRPO" heatmap shows a more uniform distribution, suggesting that the GRPO process introduces a bias towards specific digit pair frequencies.
* The values in the "After GRPO" heatmaps are significantly higher than those in the "Before GRPO" heatmap, indicating that the GRPO process increases the frequency of certain digit pairs.
### Interpretation
The data suggests that the GRPO process alters the distribution of digit pairs in 'x' and 'y'. The temperature parameter controls the degree of this alteration. A higher temperature leads to a more pronounced shift towards higher digit counts and a stronger correlation between the number of digits in 'x' and 'y'.
This could indicate that GRPO is a process that favors the combination of larger digit numbers. The diagonal trend suggests that the process is more likely to generate digit pairs where 'x' and 'y' have similar digit counts.
The significant difference between the "Before GRPO" and "After GRPO" heatmaps suggests that GRPO is not merely a random process, but rather a transformation that introduces a specific pattern into the digit distribution. The temperature parameter likely controls the intensity of this pattern.
Further investigation would be needed to understand the underlying mechanism of the GRPO process and the reasons for the observed temperature-dependent behavior. The data could be used to optimize the GRPO process for specific applications or to identify potential biases in the generated digit pairs.