TECHNICAL ASSET FINGERPRINT
c3157bd3a0f4301c74089679
Click to view fullscreen
Press ESC or click to close
FOUND IN PAPERS
EXPERT: healer-alpha-free VERSION 1
RUNTIME: free/openrouter/healer-alpha
INTEL_VERIFIED
\n
## Heatmap Series: GRPO Effect on Digit-Length Performance
### Overview
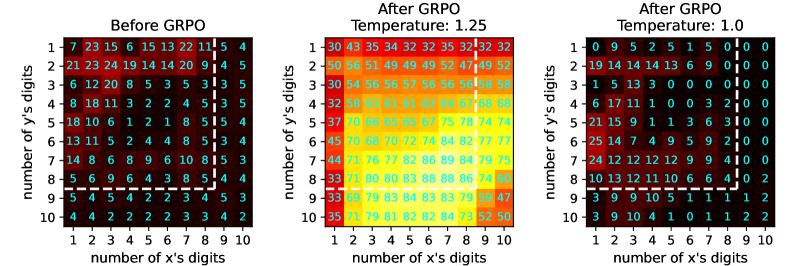
The image displays three horizontally arranged heatmaps comparing performance metrics before and after applying a process called "GRPO" at two different temperature settings. Each heatmap plots the "number of y's digits" (vertical axis) against the "number of x's digits" (horizontal axis), with cell values representing a performance metric (likely accuracy, success rate, or a similar score). The color scale ranges from dark (low values) to bright yellow/white (high values).
### Components/Axes
* **Titles (Top of each heatmap):**
* Left: "Before GRPO"
* Center: "After GRPO Temperature: 1.25"
* Right: "After GRPO Temperature: 1.0"
* **Vertical Axis (Y-axis, left side of each heatmap):** Labeled "number of y's digits". Markers range from 1 to 10, incrementing downward.
* **Horizontal Axis (X-axis, bottom of each heatmap):** Labeled "number of x's digits". Markers range from 1 to 10, incrementing rightward.
* **Data Grid:** Each heatmap is a 10x10 grid. The value in each cell is explicitly written as a number.
* **Color Mapping:** A consistent gradient is used across all three charts. Dark colors (black/dark red) represent low values, transitioning through red, orange, and yellow to bright white for the highest values.
### Detailed Analysis
**1. Before GRPO (Left Heatmap)**
* **Visual Trend:** Values are generally low across the entire grid, with the highest values concentrated in the top-left corner (low digit counts for both x and y). Performance degrades significantly as the number of digits increases, especially for y.
* **Data Extraction (Row by Row, y=1 to 10):**
* y=1: 7, 23, 15, 6, 15, 13, 22, 11, 5, 4
* y=2: 21, 23, 24, 19, 14, 14, 20, 9, 4, 5
* y=3: 6, 12, 20, 8, 5, 3, 5, 3, 3, 5
* y=4: 8, 18, 11, 3, 2, 2, 4, 5, 5, 5
* y=5: 18, 10, 6, 1, 2, 1, 8, 5, 4, 4
* y=6: 13, 11, 5, 2, 4, 4, 8, 5, 4, 3
* y=7: 14, 8, 6, 9, 6, 10, 8, 5, 3, 4
* y=8: 5, 6, 9, 6, 4, 3, 8, 5, 4, 4
* y=9: 4, 5, 3, 4, 2, 2, 4, 4, 3, 3
* y=10: 4, 4, 2, 2, 1, 1, 4, 2, 4, 2
**2. After GRPO Temperature: 1.25 (Center Heatmap)**
* **Visual Trend:** A dramatic, widespread increase in values across the entire grid compared to the "Before" state. The heatmap is predominantly bright orange and yellow, indicating high performance. The highest values form a broad plateau in the center and lower-right regions (higher digit counts).
* **Data Extraction (Row by Row, y=1 to 10):**
* y=1: 30, 43, 35, 34, 32, 35, 32, 37, 32, 32
* y=2: 50, 49, 49, 49, 49, 52, 47, 49, 52, 52
* y=3: 30, 64, 56, 56, 57, 50, 53, 56, 56, 56
* y=4: 32, 67, 67, 67, 67, 67, 67, 67, 67, 67
* y=5: 37, 60, 72, 72, 72, 75, 78, 74, 74, 74
* y=6: 45, 63, 70, 72, 74, 78, 84, 77, 77, 77
* y=7: 47, 71, 76, 77, 77, 82, 86, 89, 84, 79, 75
* y=8: 33, 71, 80, 83, 86, 84, 83, 79, 79, 74
* y=9: 37, 75, 79, 83, 84, 83, 83, 79, 79, 47
* y=10: 35, 76, 79, 81, 83, 82, 84, 79, 53, 56
**3. After GRPO Temperature: 1.0 (Right Heatmap)**
* **Visual Trend:** Performance is highly variable. The top-right quadrant (high x digits, low y digits) shows many zeros, indicating complete failure. The bottom-left quadrant (low x digits, high y digits) shows moderate to high values. There is a clear diagonal boundary separating regions of success from regions of failure.
* **Data Extraction (Row by Row, y=1 to 10):**
* y=1: 0, 9, 2, 5, 1, 5, 0, 0, 0, 0
* y=2: 19, 14, 14, 14, 13, 6, 9, 2, 0, 0
* y=3: 1, 5, 13, 3, 0, 0, 0, 0, 0, 0
* y=4: 6, 17, 11, 1, 0, 0, 3, 2, 0, 0
* y=5: 21, 15, 9, 1, 1, 3, 6, 3, 0, 1
* y=6: 25, 14, 7, 4, 9, 5, 9, 2, 0, 0
* y=7: 24, 12, 12, 12, 12, 9, 9, 4, 1, 0
* y=8: 10, 13, 12, 11, 10, 6, 6, 4, 0, 2
* y=9: 3, 9, 9, 10, 4, 1, 0, 1, 2, 2
* y=10: 3, 9, 9, 10, 4, 1, 0, 1, 2, 2
### Key Observations
1. **Baseline Performance ("Before GRPO"):** The system struggles with longer digit sequences. Peak performance (24) is limited to simple cases (e.g., 2-digit x and y). Performance for y=10 is uniformly poor (≤4).
2. **Effect of GRPO at T=1.25:** This setting yields a massive and robust performance boost. The system now handles complex cases (e.g., 10-digit x and y) with scores in the 50s-80s, a >10x improvement over baseline. The performance landscape is relatively smooth and high.
3. **Effect of GRPO at T=1.0:** This setting creates a brittle, specialized performance profile. It maintains good performance for cases where the number of y digits is greater than or equal to the number of x digits (lower-left triangle), but fails catastrophically (scores of 0) when x digits outnumber y digits (upper-right triangle).
4. **Temperature Sensitivity:** The GRPO process is highly sensitive to the temperature parameter. T=1.25 promotes general, high performance, while T=1.0 creates a sharp, diagonal decision boundary.
### Interpretation
This data demonstrates the impact of the GRPO optimization technique on a model's ability to handle tasks parameterized by the digit lengths of two variables, x and y.
* **What the data suggests:** The "Before" state shows a model with limited capacity, failing as problem complexity (digit length) increases. GRPO is an effective training or adaptation method that significantly enhances this capacity.
* **Relationship between elements:** The temperature parameter in GRPO acts as a crucial control knob. A higher temperature (1.25) appears to encourage broader generalization, leading to uniformly high scores. A lower temperature (1.0) seems to enforce a stricter, more categorical rule—possibly "only succeed when y is at least as complex as x"—resulting in the observed diagonal split between success and failure.
* **Notable anomalies:** The perfect zeros in the T=1.0 chart are striking. They indicate not just poor performance, but total failure for specific input configurations. The identical rows for y=9 and y=10 in the T=1.0 chart (3,9,9,10,4,1,0,1,2,2) suggest the model's behavior has saturated or hit a systematic limit for the highest y-digit counts under this setting.
* **Underlying implication:** The choice of temperature during GRPO doesn't just scale performance; it fundamentally changes the model's decision boundary and failure modes. This has critical implications for deploying such models, where understanding the conditions for failure (as clearly mapped in the T=1.0 chart) is as important as knowing peak performance.
DECODING INTELLIGENCE...