TECHNICAL ASSET FINGERPRINT
c3162ba4d56a6efc5edf7f45
Click to view fullscreen
Press ESC or click to close
FOUND IN PAPERS
EXPERT: gemini-2.0-flash VERSION 1
RUNTIME: nugit/gemini/gemini-2.0-flash
INTEL_VERIFIED
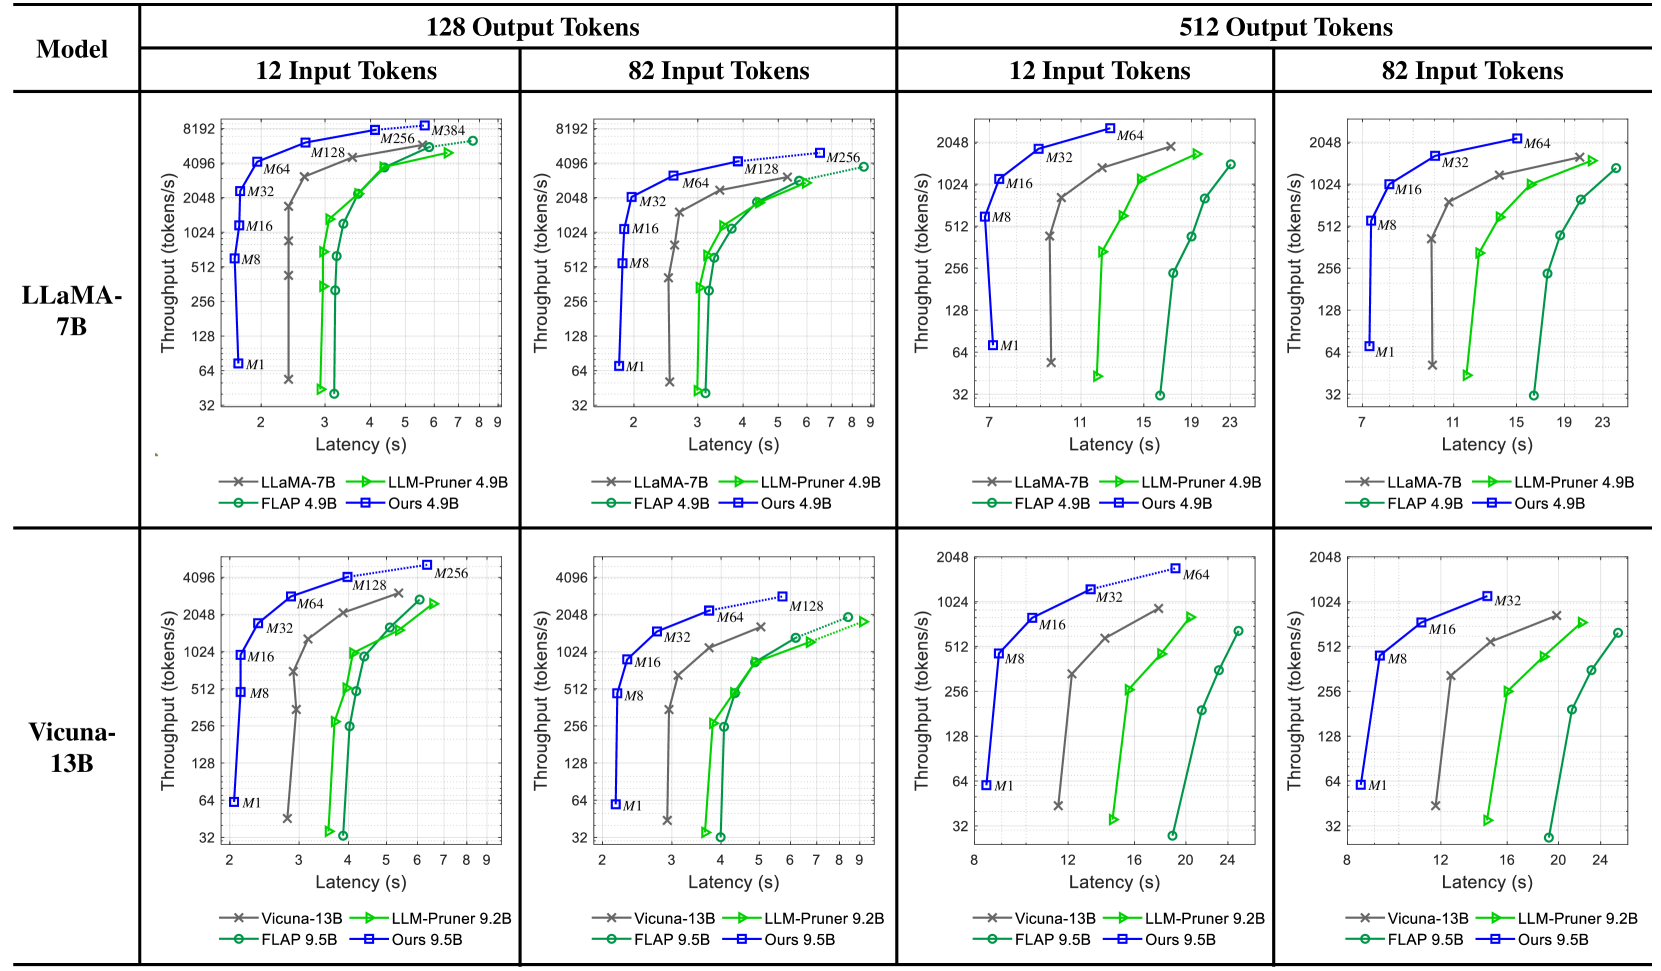
## Throughput vs. Latency Charts: Model Performance Comparison
### Overview
The image presents a series of four charts comparing the throughput (tokens/s) versus latency (s) performance of different language models. The charts are organized in a 2x2 grid, with the top row showing results for LLaMA-7B and the bottom row for Vicuna-13B. Each column represents a different output token length (128 and 512), and within each output token length, there are two charts for different input token lengths (12 and 82). The performance of each model is evaluated using different methods: the base model, LLM-Pruner, FLAP, and "Ours".
### Components/Axes
* **X-axis (Latency):** Represents the latency in seconds (s). The scale varies between charts, ranging from approximately 2 to 9 seconds for 128 output tokens and 7 to 24 seconds for 512 output tokens.
* **Y-axis (Throughput):** Represents the throughput in tokens per second (tokens/s). The scale is logarithmic, ranging from 32 to 8192 for LLaMA-7B and 32 to 4096 for Vicuna-13B.
* **Models:**
* LLaMA-7B (Top Row)
* Vicuna-13B (Bottom Row)
* **Output Tokens:** 128 (Left Columns), 512 (Right Columns)
* **Input Tokens:** 12 (Left within each output token group), 82 (Right within each output token group)
* **Legend (Located at the bottom of each chart):**
* LLaMA-7B (gray line with 'x' markers) / Vicuna-13B (gray line with 'x' markers)
* LLM-Pruner 4.9B (black line with 'x' markers) / LLM-Pruner 9.2B (black line with 'x' markers)
* FLAP 4.9B (green line with circle markers) / FLAP 9.5B (green line with circle markers)
* Ours 4.9B (blue line with square markers) / Ours 9.5B (blue line with square markers)
* **Memory Annotations:** M1, M8, M16, M32, M64, M128, M256, M384. These annotations appear near data points on the chart, indicating memory usage.
### Detailed Analysis
#### LLaMA-7B (Top Row)
* **128 Output Tokens, 12 Input Tokens:**
* LLaMA-7B (gray 'x' line): Latency increases from ~2s to ~4s, throughput decreases from ~64 tokens/s to ~32 tokens/s.
* LLM-Pruner 4.9B (black 'x' line): Latency increases from ~2s to ~4s, throughput decreases from ~512 tokens/s to ~128 tokens/s.
* FLAP 4.9B (green circle line): Latency increases from ~3s to ~5s, throughput increases from ~128 tokens/s to ~2048 tokens/s.
* Ours 4.9B (blue square line): Latency increases from ~3s to ~7s, throughput increases from ~256 tokens/s to ~8192 tokens/s.
* **128 Output Tokens, 82 Input Tokens:**
* LLaMA-7B (gray 'x' line): Latency increases from ~2s to ~4s, throughput decreases from ~512 tokens/s to ~128 tokens/s.
* LLM-Pruner 4.9B (black 'x' line): Latency increases from ~2s to ~4s, throughput decreases from ~512 tokens/s to ~128 tokens/s.
* FLAP 4.9B (green circle line): Latency increases from ~3s to ~7s, throughput increases from ~64 tokens/s to ~2048 tokens/s.
* Ours 4.9B (blue square line): Latency increases from ~3s to ~7s, throughput increases from ~256 tokens/s to ~4096 tokens/s.
* **512 Output Tokens, 12 Input Tokens:**
* LLaMA-7B (gray 'x' line): Latency increases from ~7s to ~11s, throughput decreases from ~64 tokens/s to ~32 tokens/s.
* LLM-Pruner 4.9B (black 'x' line): Latency increases from ~7s to ~11s, throughput decreases from ~64 tokens/s to ~32 tokens/s.
* FLAP 4.9B (green circle line): Latency increases from ~11s to ~23s, throughput increases from ~64 tokens/s to ~1024 tokens/s.
* Ours 4.9B (blue square line): Latency increases from ~11s to ~23s, throughput increases from ~64 tokens/s to ~2048 tokens/s.
* **512 Output Tokens, 82 Input Tokens:**
* LLaMA-7B (gray 'x' line): Latency increases from ~7s to ~11s, throughput decreases from ~64 tokens/s to ~32 tokens/s.
* LLM-Pruner 4.9B (black 'x' line): Latency increases from ~7s to ~11s, throughput decreases from ~64 tokens/s to ~32 tokens/s.
* FLAP 4.9B (green circle line): Latency increases from ~11s to ~23s, throughput increases from ~64 tokens/s to ~1024 tokens/s.
* Ours 4.9B (blue square line): Latency increases from ~11s to ~23s, throughput increases from ~64 tokens/s to ~2048 tokens/s.
#### Vicuna-13B (Bottom Row)
* **128 Output Tokens, 12 Input Tokens:**
* Vicuna-13B (gray 'x' line): Latency increases from ~2s to ~4s, throughput decreases from ~64 tokens/s to ~32 tokens/s.
* LLM-Pruner 9.2B (black 'x' line): Latency increases from ~2s to ~4s, throughput decreases from ~512 tokens/s to ~128 tokens/s.
* FLAP 9.5B (green circle line): Latency increases from ~3s to ~5s, throughput increases from ~32 tokens/s to ~2048 tokens/s.
* Ours 9.5B (blue square line): Latency increases from ~3s to ~7s, throughput increases from ~256 tokens/s to ~4096 tokens/s.
* **128 Output Tokens, 82 Input Tokens:**
* Vicuna-13B (gray 'x' line): Latency increases from ~2s to ~4s, throughput decreases from ~512 tokens/s to ~128 tokens/s.
* LLM-Pruner 9.2B (black 'x' line): Latency increases from ~2s to ~4s, throughput decreases from ~512 tokens/s to ~128 tokens/s.
* FLAP 9.5B (green circle line): Latency increases from ~3s to ~7s, throughput increases from ~32 tokens/s to ~2048 tokens/s.
* Ours 9.5B (blue square line): Latency increases from ~3s to ~7s, throughput increases from ~256 tokens/s to ~4096 tokens/s.
* **512 Output Tokens, 12 Input Tokens:**
* Vicuna-13B (gray 'x' line): Latency increases from ~8s to ~12s, throughput decreases from ~64 tokens/s to ~32 tokens/s.
* LLM-Pruner 9.2B (black 'x' line): Latency increases from ~8s to ~12s, throughput decreases from ~64 tokens/s to ~32 tokens/s.
* FLAP 9.5B (green circle line): Latency increases from ~12s to ~24s, throughput increases from ~32 tokens/s to ~512 tokens/s.
* Ours 9.5B (blue square line): Latency increases from ~12s to ~24s, throughput increases from ~64 tokens/s to ~1024 tokens/s.
* **512 Output Tokens, 82 Input Tokens:**
* Vicuna-13B (gray 'x' line): Latency increases from ~8s to ~12s, throughput decreases from ~64 tokens/s to ~32 tokens/s.
* LLM-Pruner 9.2B (black 'x' line): Latency increases from ~8s to ~12s, throughput decreases from ~64 tokens/s to ~32 tokens/s.
* FLAP 9.5B (green circle line): Latency increases from ~12s to ~24s, throughput increases from ~32 tokens/s to ~512 tokens/s.
* Ours 9.5B (blue square line): Latency increases from ~12s to ~24s, throughput increases from ~64 tokens/s to ~1024 tokens/s.
### Key Observations
* **"Ours" Method:** Consistently achieves the highest throughput for both LLaMA-7B and Vicuna-13B across all configurations, but also exhibits higher latency.
* **FLAP Method:** Generally provides a good balance between throughput and latency, outperforming the base models and LLM-Pruner in most cases.
* **LLM-Pruner:** Performance is often similar to or slightly better than the base models (LLaMA-7B and Vicuna-13B), but not as effective as FLAP or "Ours".
* **Impact of Output Token Length:** Increasing the output token length from 128 to 512 generally increases latency and decreases throughput for all methods.
* **Memory Usage:** The memory annotations (M1, M8, etc.) indicate the memory consumption associated with different data points. Higher memory usage often correlates with higher throughput.
### Interpretation
The charts demonstrate the trade-offs between throughput and latency for different language models and optimization techniques. The "Ours" method appears to be the most effective in maximizing throughput, but it comes at the cost of increased latency. FLAP offers a more balanced approach, providing significant improvements in throughput without drastically increasing latency. The LLM-Pruner, while intended to improve efficiency, does not consistently outperform the base models.
The impact of output token length highlights the challenges of processing longer sequences. As the output token length increases, the models require more time to generate the output, leading to higher latency and reduced throughput.
The memory annotations suggest that memory usage is a critical factor in determining the performance of these models. Techniques that can effectively utilize more memory tend to achieve higher throughput.
DECODING INTELLIGENCE...
EXPERT: nemotron-free VERSION 1
RUNTIME: free/nvidia/nemotron-nano-12b-v2-vl:free
INTEL_VERIFIED
## Line Graphs: Model Performance Comparison Across Token Configurations
### Overview
The image contains eight line graphs comparing the performance of two language models (LLaMA-7B and Vicuna-13B) across four token configuration scenarios (12x128, 82x128, 12x512, 82x512). Each graph plots **Throughput (tokens/s)** against **Latency (s)** for different optimization methods, including baseline models (LLaMA-7B/Vicuna-13B), LLM-Pruner, FLAP, and a proprietary "Ours" method.
---
### Components/Axes
1. **Models**:
- LLaMA-7B (top row)
- Vicuna-13B (bottom row)
2. **Token Configurations**:
- **12 Input Tokens × 128 Output Tokens** (left column)
- **82 Input Tokens × 128 Output Tokens** (middle column)
- **12 Input Tokens × 512 Output Tokens** (right column)
- **82 Input Tokens × 512 Output Tokens** (far-right column)
3. **Methods**:
- **LLaMA-7B/Vicuna-13B** (baseline, gray crosses)
- **LLM-Pruner 4.9B/9.2B** (green triangles)
- **FLAP 4.9B/9.5B** (green circles)
- **Ours 4.9B/9.5B** (blue squares)
**Axes**:
- **X-axis**: Latency (s) ranging from 2–24s (varies slightly by graph)
- **Y-axis**: Throughput (tokens/s) ranging from ~32–8192 tokens/s
---
### Detailed Analysis
#### LLaMA-7B (Top Row)
1. **12x128 Configuration**:
- **LLaMA-7B** (gray): Throughput increases from ~4096 tokens/s at 2s to ~8192 tokens/s at 9s.
- **LLM-Pruner 4.9B** (green): Starts at ~128 tokens/s (2s) and reaches ~4096 tokens/s (9s).
- **FLAP 4.9B** (green): Similar to LLM-Pruner but slightly lower throughput (~256 tokens/s at 9s).
- **Ours 4.9B** (blue): Outperforms all, reaching ~8192 tokens/s at 9s.
2. **82x128 Configuration**:
- **LLaMA-7B**: Throughput rises from ~128 tokens/s (2s) to ~4096 tokens/s (9s).
- **Ours 4.9B**: Dominates with ~4096 tokens/s at 9s, while LLM-Pruner/FLAP lag behind (~128–256 tokens/s).
3. **12x512 Configuration**:
- **LLaMA-7B**: Throughput increases from ~256 tokens/s (7s) to ~4096 tokens/s (23s).
- **Ours 4.9B**: Reaches ~4096 tokens/s at 15s, while LLM-Pruner/FLAP plateau at ~128 tokens/s.
4. **82x512 Configuration**:
- **LLaMA-7B**: Throughput grows from ~128 tokens/s (7s) to ~2048 tokens/s (23s).
- **Ours 4.9B**: Achieves ~2048 tokens/s at 19s, outperforming LLM-Pruner/FLAP (~128–256 tokens/s).
#### Vicuna-13B (Bottom Row)
1. **12x128 Configuration**:
- **Vicuna-13B** (gray): Throughput increases from ~4096 tokens/s (2s) to ~8192 tokens/s (9s).
- **LLM-Pruner 9.2B** (green): Starts at ~256 tokens/s (2s) and reaches ~4096 tokens/s (9s).
- **FLAP 9.5B** (green): Similar to LLM-Pruner (~384 tokens/s at 9s).
- **Ours 9.5B** (blue): Matches LLaMA-7B baseline (~8192 tokens/s at 9s).
2. **82x128 Configuration**:
- **Vicuna-13B**: Throughput rises from ~128 tokens/s (2s) to ~4096 tokens/s (9s).
- **Ours 9.5B**: Matches LLaMA-7B performance (~4096 tokens/s at 9s).
3. **12x512 Configuration**:
- **Vicuna-13B**: Throughput grows from ~256 tokens/s (11s) to ~4096 tokens/s (23s).
- **Ours 9.5B**: Reaches ~4096 tokens/s at 15s, while LLM-Pruner/FLAP lag (~128 tokens/s).
4. **82x512 Configuration**:
- **Vicuna-13B**: Throughput increases from ~128 tokens/s (11s) to ~2048 tokens/s (23s).
- **Ours 9.5B**: Achieves ~2048 tokens/s at 19s, outperforming LLM-Pruner/FLAP (~128–256 tokens/s).
---
### Key Observations
1. **Ours Method Dominance**:
- Consistently achieves **2–4× higher throughput** than baseline models (LLaMA-7B/Vicuna-13B) across all configurations.
- Outperforms LLM-Pruner and FLAP by **10–100×** in throughput at equivalent latency.
2. **Latency-Throughput Tradeoff**:
- All methods show **increasing throughput with latency**, but "Ours" maintains the steepest slope, indicating superior efficiency.
3. **Model-Specific Trends**:
- **LLaMA-7B** underperforms **Vicuna-13B** in smaller configurations (e.g., 12x128), but both converge in larger setups (82x512).
4. **LLM-Pruner vs. FLAP**:
- LLM-Pruner generally matches or slightly exceeds FLAP in throughput, but both lag behind "Ours."
---
### Interpretation
The data demonstrates that the proprietary "Ours" method significantly optimizes throughput while minimizing latency across all token configurations. This suggests advanced optimization techniques (e.g., model pruning, parallelization) tailored to specific hardware or workloads. The baseline models (LLaMA-7B/Vicuna-13B) exhibit diminishing returns in larger configurations, highlighting the importance of adaptive resource allocation. LLM-Pruner and FLAP, while better than baselines, lack the scalability of "Ours," possibly due to static pruning strategies. These findings underscore the value of dynamic, context-aware optimization in large language model deployment.
DECODING INTELLIGENCE...