## Diagram: Modular Arithmetic Representation
### Overview
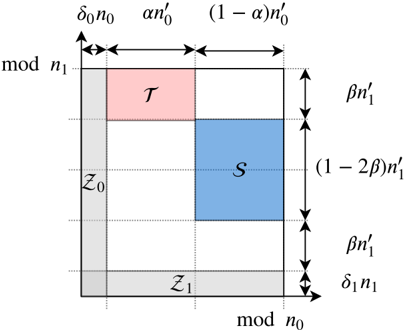
The image is a diagram representing modular arithmetic concepts, likely related to number theory or cryptography. It visualizes relationships between different parameters and their modular representations. The diagram uses a square grid to represent the modular space, with labeled regions and dimensions.
### Components/Axes
* **X-axis:** Labeled "mod n₀" (modulo n₀). The axis is divided into three segments with lengths δ₀n₀, αn'₀, and (1-α)n'₀.
* **Y-axis:** Labeled "mod n₁" (modulo n₁). The axis is divided into four segments with lengths δ₁n'₁, βn'₁, (1-2β)n'₁, and βn'₁.
* **Regions:**
* Region labeled "T" (red). Located in the top-left corner.
* Region labeled "S" (blue). Located in the center.
* Region labeled "Z₀" (gray). Located on the left side.
* Region labeled "Z₁" (gray). Located on the bottom.
### Detailed Analysis
* **X-axis segments:**
* The first segment has a length of δ₀n₀.
* The second segment has a length of αn'₀.
* The third segment has a length of (1-α)n'₀.
* **Y-axis segments:**
* The first segment has a length of βn'₁.
* The second segment has a length of (1-2β)n'₁.
* The third segment has a length of βn'₁.
* The fourth segment has a length of δ₁n'₁.
* **Region T (red):** A rectangle in the top-left corner with width δ₀n₀ and height βn'₁.
* **Region S (blue):** A square in the center with width (1-α)n'₀ and height (1-2β)n'₁.
* **Region Z₀ (gray):** A rectangle on the left side with width δ₀n₀ and height (1-2β)n'₁.
* **Region Z₁ (gray):** A rectangle on the bottom with width αn'₀ and height δ₁n'₁.
### Key Observations
* The diagram represents a modular space with dimensions related to n₀ and n₁.
* The parameters α, β, δ₀, and δ₁ define the proportions of the segments along the axes.
* The regions T, S, Z₀, and Z₁ represent different subsets or properties within the modular space.
### Interpretation
The diagram likely illustrates a mathematical concept related to modular arithmetic, possibly in the context of error-correcting codes, cryptography, or number theory. The regions T, S, Z₀, and Z₁ likely represent different sets or conditions within the modular space defined by n₀ and n₁. The parameters α, β, δ₀, and δ₁ control the relative sizes and positions of these regions. The specific meaning of these regions and parameters would depend on the context in which this diagram is used. The diagram is a visual aid to understand the relationships between these parameters and their modular representations.