## Line Chart: Step Length vs Reasoning Tokens for Four Shot Hard Blocksworld
### Overview
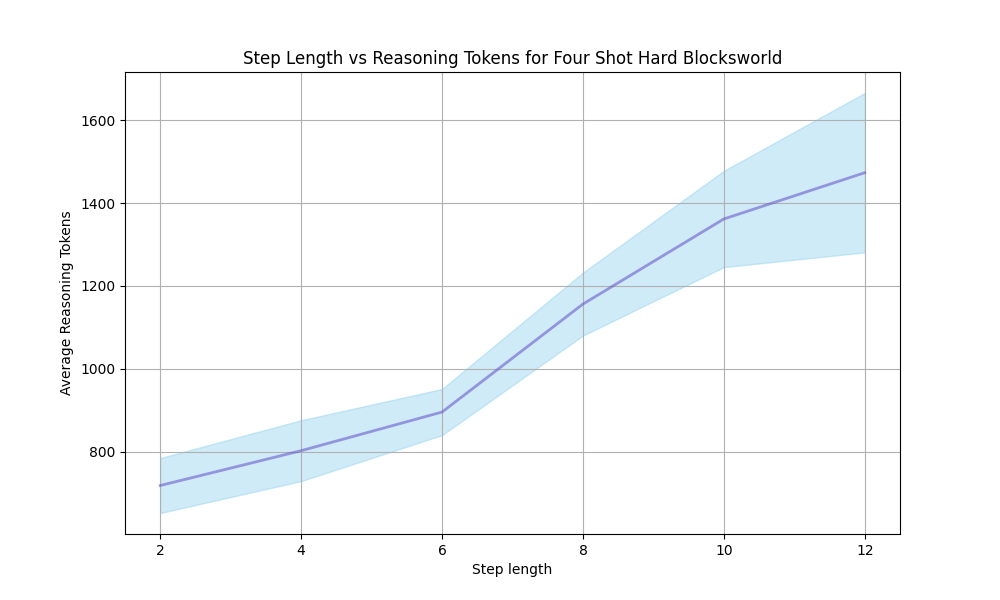
The chart illustrates the relationship between step length (x-axis) and average reasoning tokens (y-axis) for a task labeled "Four Shot Hard Blocksworld." A single blue line with a shaded light-blue confidence interval represents the data, showing a clear upward trend as step length increases.
### Components/Axes
- **Title**: "Step Length vs Reasoning Tokens for Four Shot Hard Blocksworld" (centered at the top).
- **X-Axis (Step Length)**:
- Label: "Step length" (bottom, horizontal).
- Scale: Discrete markers at 2, 4, 6, 8, 10, 12 (evenly spaced).
- **Y-Axis (Average Reasoning Tokens)**:
- Label: "Average Reasoning Tokens" (left, vertical).
- Scale: Continuous from 600 to 1600, with gridlines at 800, 1000, 1200, 1400, 1600.
- **Legend**:
- Position: Top-right corner.
- Content: Single entry labeled "Average Reasoning Tokens" with a blue line and light-blue shaded area.
- **Line and Shading**:
- Line: Solid blue, representing the average reasoning tokens.
- Shaded Area: Light-blue band around the line, indicating ±150 tokens of variability.
### Detailed Analysis
- **Data Points**:
- Step 2: 720 tokens (range: 570–870).
- Step 4: 800 tokens (range: 650–950).
- Step 6: 900 tokens (range: 750–1050).
- Step 8: 1150 tokens (range: 1000–1300).
- Step 10: 1350 tokens (range: 1200–1500).
- Step 12: 1480 tokens (range: 1330–1630).
- **Trends**:
- The blue line slopes upward consistently, indicating a positive linear relationship between step length and reasoning tokens.
- The shaded area maintains a constant width (±150 tokens) across all step lengths, suggesting stable variability in reasoning token usage.
### Key Observations
1. **Linear Correlation**: Reasoning tokens increase by approximately 160 tokens per step length increment (e.g., 720 → 800 → 900 → 1150 → 1350 → 1480).
2. **Shading Consistency**: The ±150 token range remains uniform, implying predictable uncertainty in token usage.
3. **Steepest Growth**: The largest token increase occurs between steps 6 and 8 (+250 tokens), followed by steps 8–10 (+200 tokens).
### Interpretation
The chart demonstrates that longer step lengths in the "Four Shot Hard Blocksworld" task require proportionally more reasoning tokens, with a near-linear relationship. The consistent ±150 token variability suggests that while the average token usage scales predictably with step length, there is a bounded level of uncertainty in computational demands. This could inform resource allocation strategies, such as optimizing step lengths to balance performance and token efficiency. The absence of outliers or deviations from the trend indicates a stable, well-defined relationship between these variables.