\n
## Scatter Plot: Confidence vs. Target Length for "philosophy"
### Overview
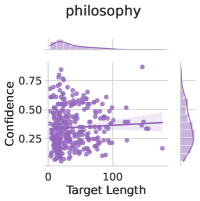
This image presents a scatter plot visualizing the relationship between "Target Length" and "Confidence" for the topic "philosophy". A density plot is overlaid on the top and right sides of the scatter plot to show the distribution of the data. A regression line with a shaded confidence interval is also present.
### Components/Axes
* **Title:** "philosophy" (positioned at the top-center)
* **X-axis:** "Target Length" (ranging from approximately 0 to 150, with tick marks at 0, 50, 100, 150)
* **Y-axis:** "Confidence" (ranging from approximately 0.2 to 0.8, with tick marks at 0.25, 0.50, 0.75)
* **Data Points:** Numerous purple dots representing individual data points.
* **Regression Line:** A purple line representing the trend of the data. It appears to have a slight negative slope.
* **Confidence Interval:** A shaded purple area around the regression line, indicating the uncertainty in the estimated trend.
* **Density Plots:** Purple shaded areas along the top and right edges, representing the distribution of data along the respective axes.
### Detailed Analysis
The scatter plot shows a generally dispersed pattern of data points.
* **Trend:** The regression line exhibits a slight downward trend, suggesting that as "Target Length" increases, "Confidence" tends to decrease, but the correlation is weak.
* **Data Distribution:** The density plot at the top indicates a concentration of data points at lower "Target Length" values. The density plot on the right shows a concentration of data points around a "Confidence" value of approximately 0.3.
* **Data Points (Approximate Values):**
* At Target Length = 0, Confidence ranges from approximately 0.2 to 0.6.
* At Target Length = 50, Confidence ranges from approximately 0.25 to 0.7.
* At Target Length = 100, Confidence ranges from approximately 0.2 to 0.55.
* At Target Length = 150, Confidence ranges from approximately 0.2 to 0.4.
* **Regression Line (Approximate Values):**
* At Target Length = 0, the regression line is at approximately Confidence = 0.45.
* At Target Length = 150, the regression line is at approximately Confidence = 0.35.
### Key Observations
* The data is widely scattered, indicating a weak correlation between "Target Length" and "Confidence".
* The confidence interval is relatively wide, suggesting a high degree of uncertainty in the estimated trend.
* There are a few outliers with high confidence values at higher target lengths.
### Interpretation
The plot suggests that for the topic of "philosophy", there is a very weak negative relationship between the length of the target text and the confidence score. Longer target lengths tend to be associated with slightly lower confidence scores, but this relationship is not strong. The wide scatter and confidence interval indicate that many other factors likely influence the confidence score, and target length is not a primary predictor. The density plots suggest that shorter target lengths are more common in the dataset, and confidence scores tend to cluster around lower values. The outliers suggest that, in some cases, longer target lengths can still yield high confidence scores, potentially indicating the presence of well-defined or easily identifiable philosophical concepts. The data does not provide a strong basis for predicting confidence based solely on target length.