## Diagram: Biological and Artificial Neural Networks & Action Potentials
### Overview
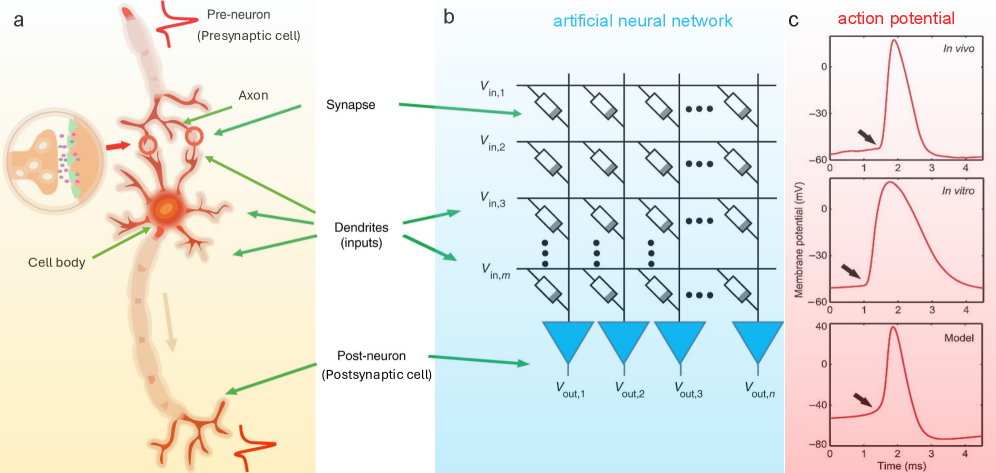
The image presents a comparative overview of a biological neuron, an artificial neural network, and action potential waveforms. It visually contrasts the structure of a biological neuron with a simplified representation of an artificial neural network, and then shows action potential curves obtained *in vivo*, *in vitro*, and from a computational model. The image is divided into three sections labeled (a), (b), and (c), arranged horizontally.
### Components/Axes
**Section (a): Biological Neuron**
* Labels: Pre-neuron (Presynaptic cell), Post-neuron (Postsynaptic cell), Axon, Synapse, Cell body, Dendrites (inputs).
* Visual elements: A stylized illustration of a neuron with labeled components. Green arrows indicate the direction of signal transmission.
**Section (b): Artificial Neural Network**
* Title: "artificial neural network"
* Labels: V<sub>in,1</sub>, V<sub>in,2</sub>, V<sub>in,3</sub>, ... V<sub>in,m</sub> (inputs), V<sub>out,1</sub>, V<sub>out,2</sub>, V<sub>out,3</sub>, ... V<sub>out,n</sub> (outputs).
* Visual elements: A diagram representing a layer of an artificial neural network. Rectangular boxes represent nodes, connected by lines representing weights.
**Section (c): Action Potential**
* Title: "action potential"
* Axes: X-axis: Time (ms), ranging from 0 to 4. Y-axis: Membrane potential (mV), ranging from -80 to 0.
* Labels: *In vivo* (pink curve), *In vitro* (blue curve), Model (red curve).
* Visual elements: Three curves representing action potential waveforms under different conditions.
### Detailed Analysis or Content Details
**Section (a): Biological Neuron**
This section depicts a typical neuron structure. The pre-neuron transmits signals via the axon to the synapse, which connects to the dendrites of the post-neuron. The cell body houses the nucleus.
**Section (b): Artificial Neural Network**
The diagram shows a simplified artificial neural network layer. There are 'm' inputs (V<sub>in,1</sub> to V<sub>in,m</sub>) connected to 'n' outputs (V<sub>out,1</sub> to V<sub>out,n</sub>). Each input is connected to each output via a weighted connection (represented by the lines). The inputs and outputs are represented as voltage values.
**Section (c): Action Potential**
* ***In vivo*** (pink): The action potential rises rapidly to approximately +20 mV at around 1 ms, then falls back to the resting potential around 3 ms. The peak is approximately 20 mV, and the minimum is around -70 mV.
* ***In vitro*** (blue): The action potential rises to approximately -10 mV at around 1.5 ms, then falls back to the resting potential around 3.5 ms. The peak is approximately -10 mV, and the minimum is around -70 mV.
* ***Model*** (red): The action potential rises to approximately +30 mV at around 1 ms, then falls back to the resting potential around 3 ms. The peak is approximately 30 mV, and the minimum is around -70 mV.
### Key Observations
* The *in vivo* and Model action potentials have similar shapes and magnitudes, with a clear peak above 0 mV.
* The *in vitro* action potential is significantly smaller in magnitude and slower in its rise and fall compared to the *in vivo* and Model potentials.
* The artificial neural network diagram is a highly simplified representation of a biological neuron, focusing on input-output relationships.
### Interpretation
The image illustrates the fundamental principles of neural signaling in both biological and artificial systems. Section (a) provides the biological context, showing the physical structure of a neuron and how signals are transmitted. Section (b) presents a simplified abstraction of this process in the form of an artificial neural network, highlighting the concept of weighted connections between inputs and outputs. Section (c) demonstrates the electrical signal (action potential) that underlies neural communication, comparing experimental data (*in vivo* and *in vitro*) with a computational model.
The differences in the action potential waveforms suggest that the *in vitro* environment may not fully replicate the conditions necessary for a robust action potential. The model appears to capture the essential features of the *in vivo* action potential, indicating the validity of the computational approach. The comparison between the biological neuron and the artificial neural network highlights the inspiration behind artificial intelligence, while also emphasizing the complexity of biological systems that are not fully captured by current artificial models. The image serves as a visual aid for understanding the relationship between biological neural networks and their artificial counterparts.