\n
## Diagram: System Architecture for Watermarking LLM Outputs
### Overview
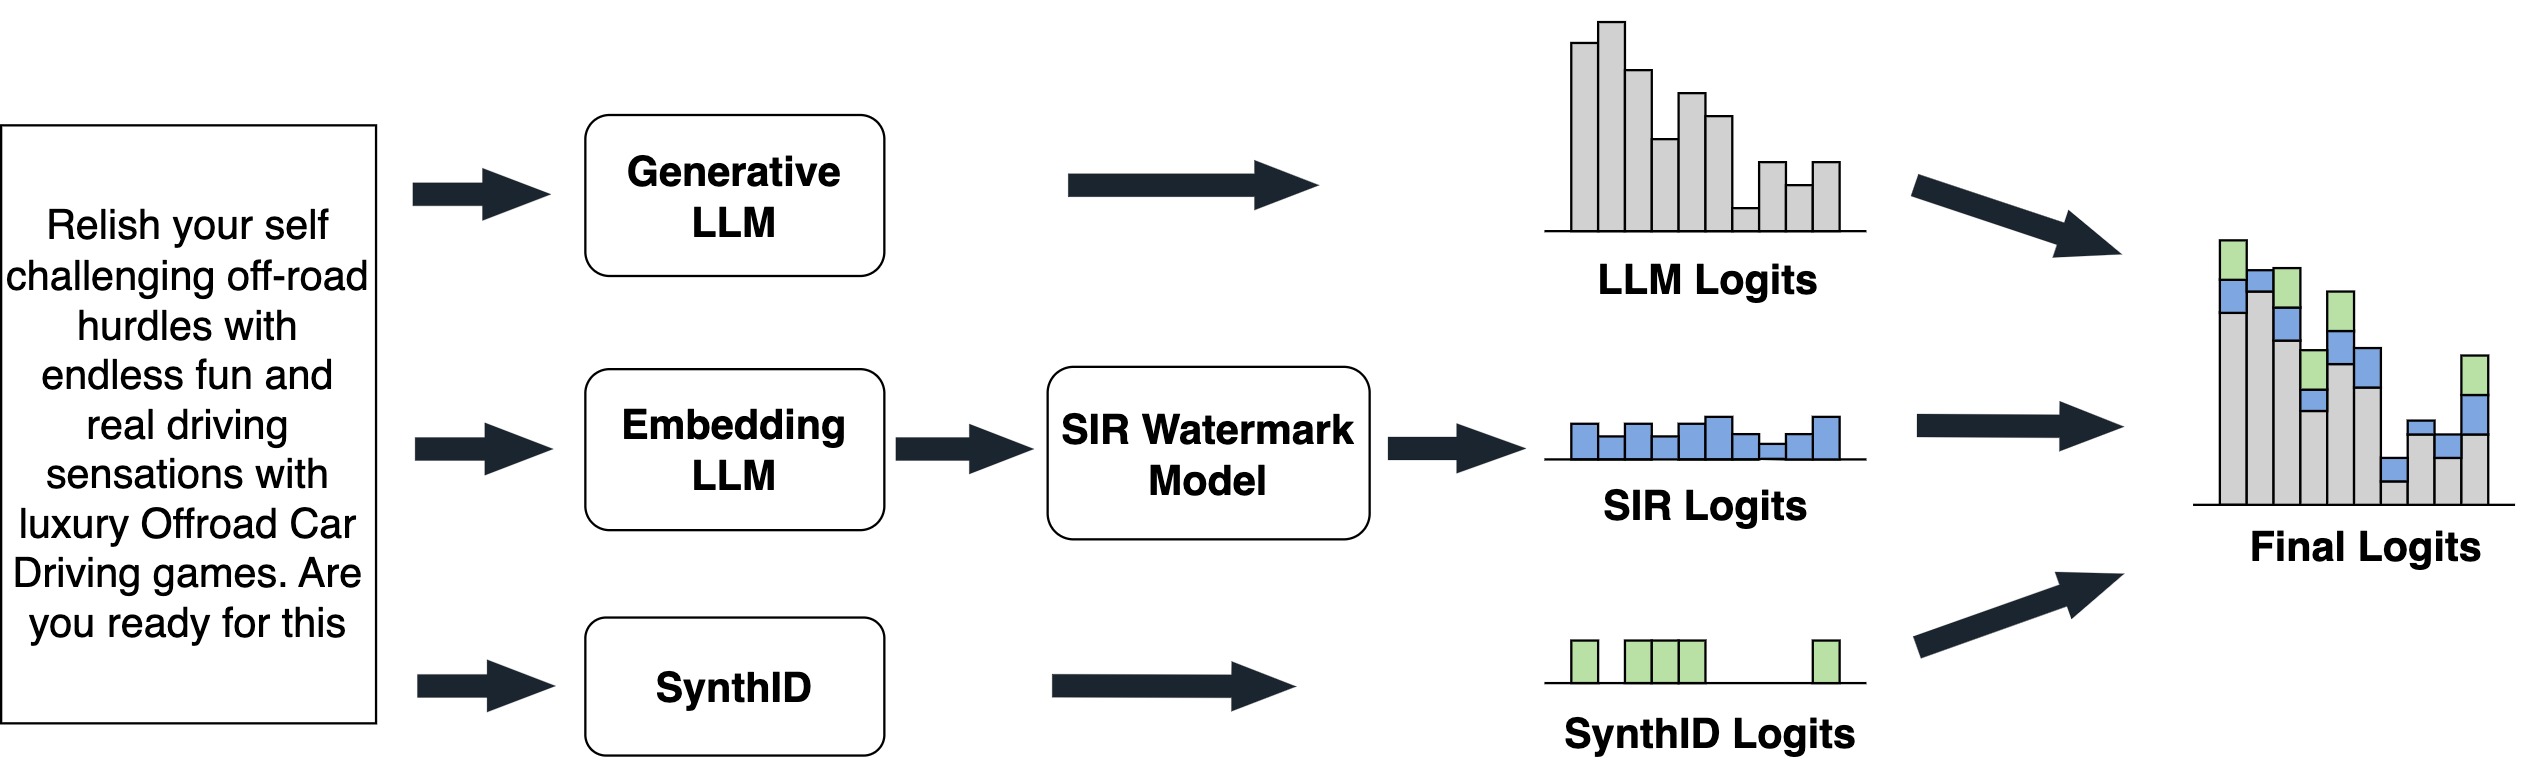
The image depicts a system architecture diagram illustrating a method for watermarking outputs from Large Language Models (LLMs). The diagram shows three input sources (Generative LLM, Embedding LLM, and SynthID) feeding into a "SIR Watermark Model," which then produces outputs ("SIR Logits") that are combined with the original LLM outputs ("LLM Logits" and "SynthID Logits") to generate "Final Logits." A block of text is present on the left side of the diagram.
### Components/Axes
The diagram consists of the following components:
* **Input Sources:**
* Generative LLM
* Embedding LLM
* SynthID
* **Watermarking Component:** SIR Watermark Model
* **Output Components:**
* LLM Logits (represented as a bar chart)
* SIR Logits (represented as a bar chart)
* SynthID Logits (represented as a bar chart)
* Final Logits (represented as a bar chart)
* **Arrows:** Indicate the flow of data between components.
* **Text Block:** Located on the left side of the diagram.
There are no explicit axes or scales present in the bar charts. The charts are qualitative representations of logits.
### Detailed Analysis or Content Details
The diagram shows a flow of information from three sources into a central watermarking model.
* **Generative LLM** feeds into **LLM Logits**. The LLM Logits bar chart shows approximately 8 bars of varying heights. The heights are roughly between 0.2 and 0.8, with some bars being slightly higher. The bars are colored in shades of gray and light blue.
* **Embedding LLM** feeds into the **SIR Watermark Model**, which then outputs **SIR Logits**. The SIR Logits bar chart shows approximately 6 bars of varying heights. The heights are roughly between 0.1 and 0.5. The bars are colored in shades of blue.
* **SynthID** feeds into **SynthID Logits**. The SynthID Logits bar chart shows approximately 6 bars of varying heights. The heights are roughly between 0.1 and 0.6. The bars are colored in shades of gray.
* **Final Logits** are generated by combining **LLM Logits**, **SIR Logits**, and **SynthID Logits**. The Final Logits bar chart shows approximately 8 bars of varying heights. The heights are roughly between 0.2 and 0.9. The bars are colored in shades of gray and light blue.
The text block on the left reads:
"Relish your self challenging off-road hurdles with endless fun and real driving sensations with luxury Offroad Car Driving games. Are you ready for this"
### Key Observations
* The diagram illustrates a parallel processing architecture where outputs from different LLMs are combined through a watermarking process.
* The bar charts representing logits are qualitative and do not provide precise numerical values.
* The "SIR Watermark Model" appears to be the core component responsible for embedding the watermark.
* The final logits are a combination of the original LLM logits and the watermarked logits.
### Interpretation
The diagram demonstrates a system for embedding a watermark into the outputs of LLMs. The use of multiple input sources (Generative LLM, Embedding LLM, SynthID) suggests a robust watermarking scheme that leverages different aspects of the LLM's output. The SIR Watermark Model likely introduces a subtle but detectable signal into the logits, allowing for the identification of watermarked text. The combination of logits in the "Final Logits" stage indicates that the watermark is integrated into the LLM's output without significantly altering its overall characteristics. The text block appears to be an advertisement for off-road driving games and is likely unrelated to the watermarking process itself, serving as a placeholder or example text. The diagram suggests a method for tracing the origin of LLM-generated text, potentially to combat misinformation or plagiarism.