## Scatter Plot: Law School Admissions
### Overview
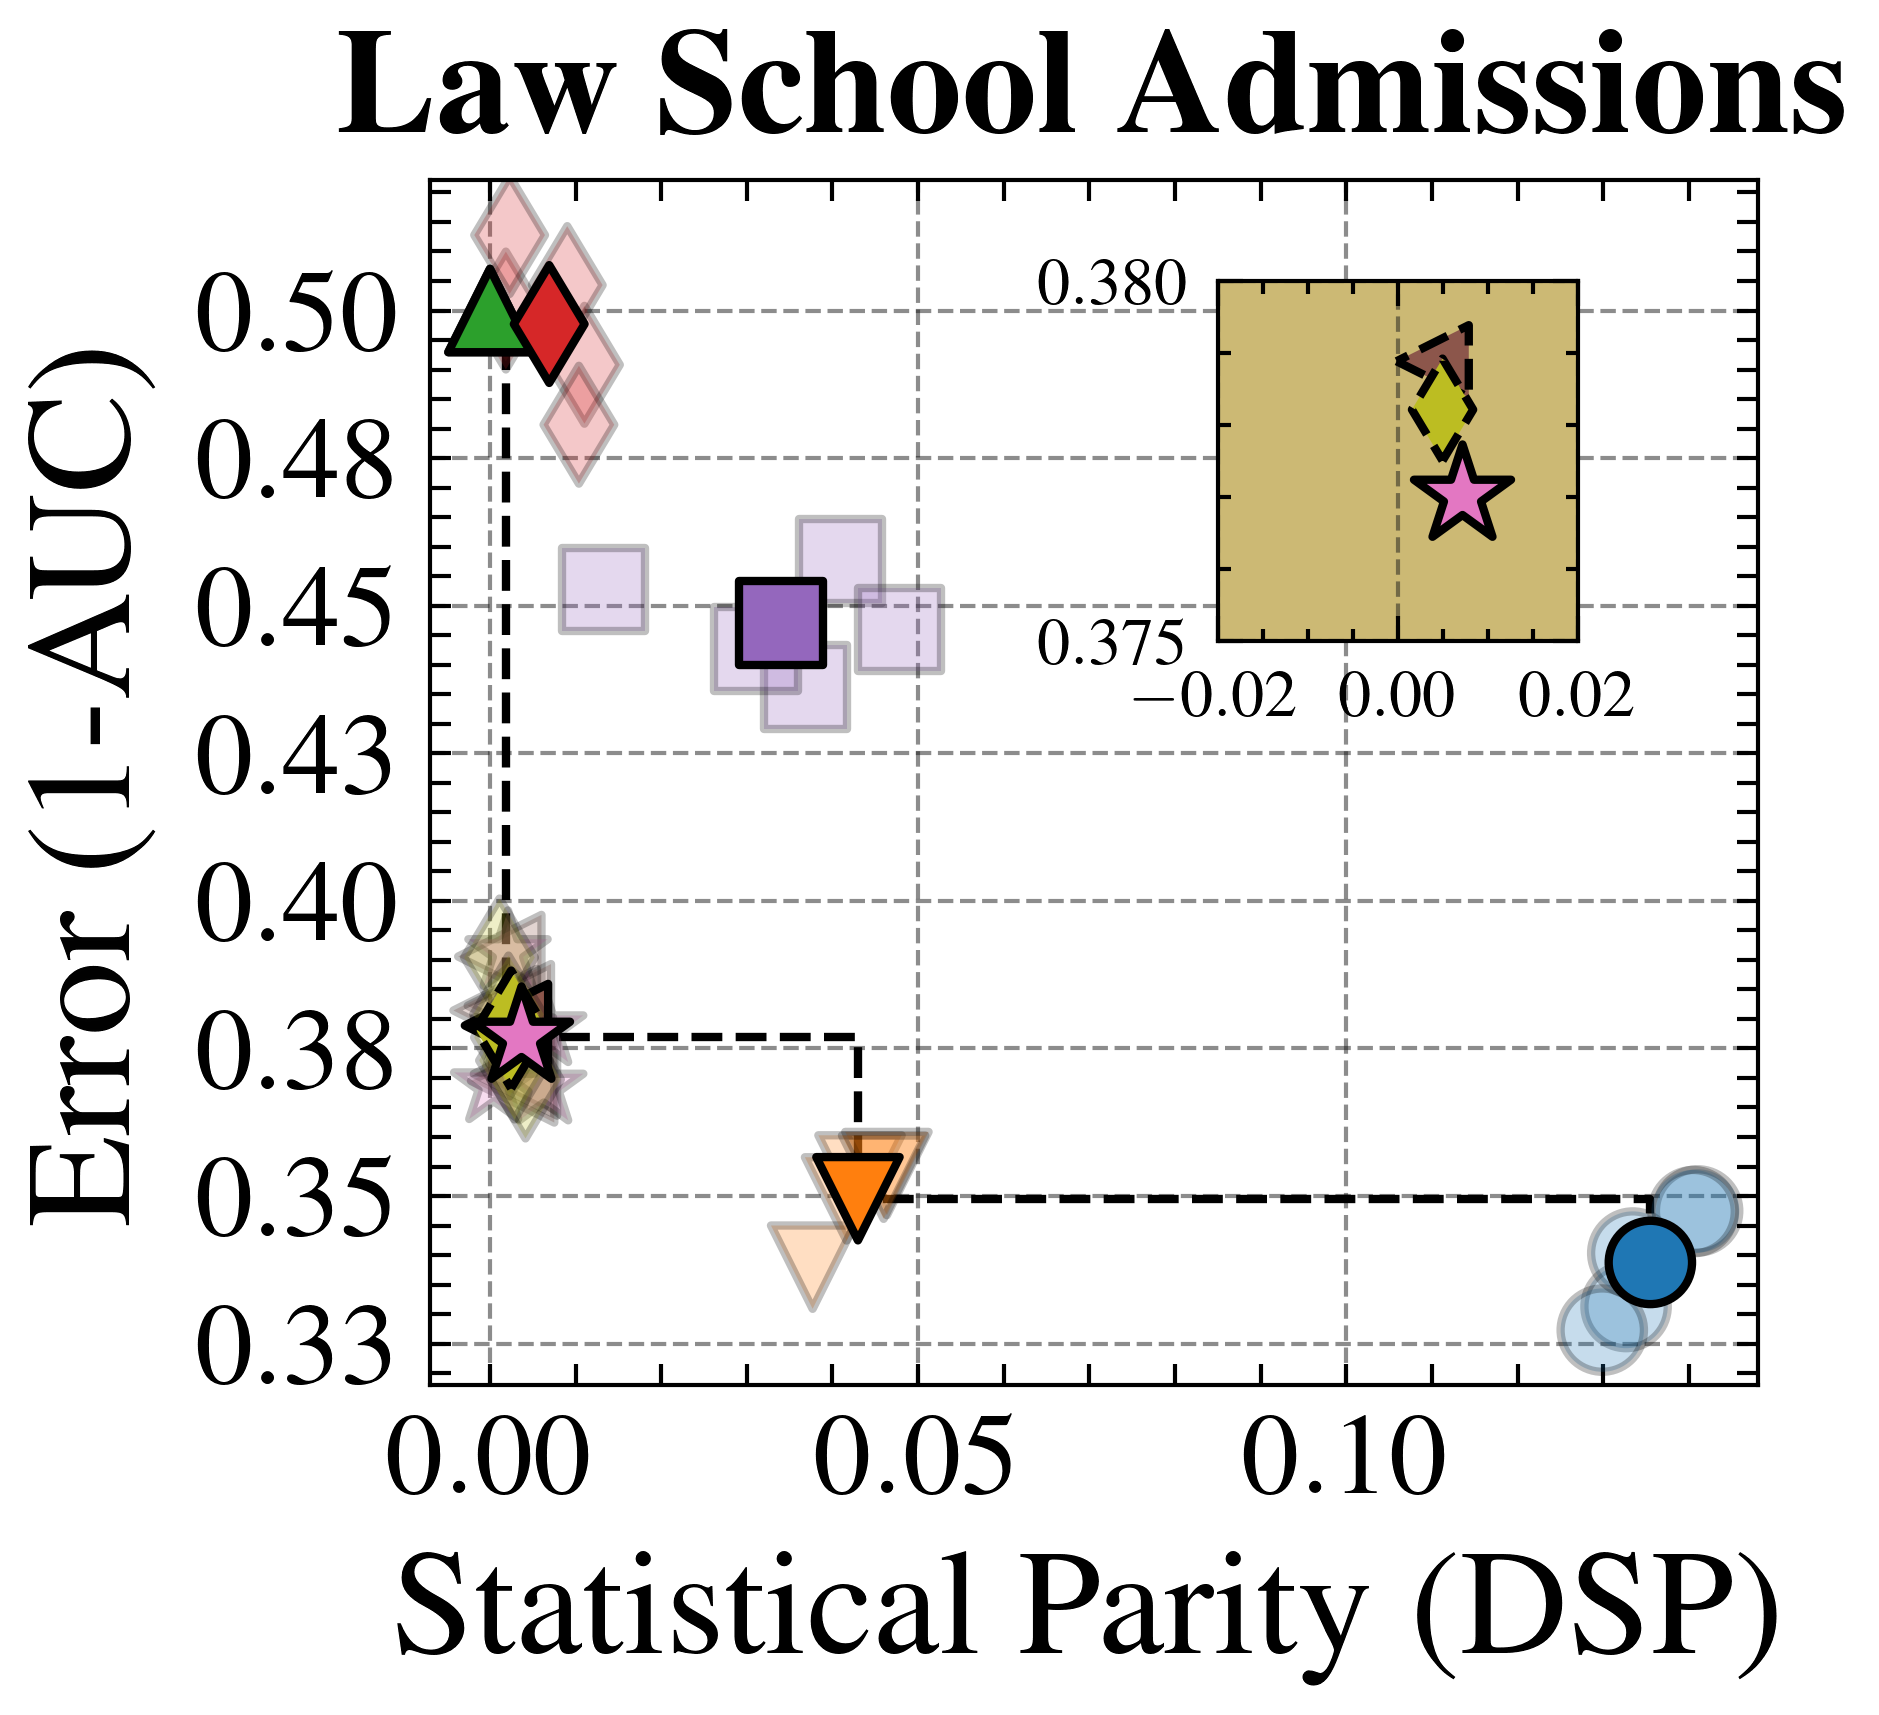
This image presents a scatter plot visualizing the relationship between Statistical Parity (DSP) and Error (1-AUC) in the context of Law School Admissions. The plot features several data points, each represented by a distinct marker with a unique color and shape. A zoomed-in section highlights a cluster of points in the upper-right quadrant.
### Components/Axes
* **Title:** "Law School Admissions" (Top-center)
* **X-axis:** "Statistical Parity (DSP)" - Scale ranges from approximately 0.00 to 0.12.
* **Y-axis:** "Error (1-AUC)" - Scale ranges from approximately 0.33 to 0.50.
* **Legend:** Implicitly defined by the marker shapes and colors.
* **Zoomed-in Section:** A rectangular region in the upper-right corner, with x-axis ranging from approximately -0.02 to 0.02 and y-axis ranging from approximately 0.375 to 0.380.
### Detailed Analysis
The scatter plot contains the following data points (approximate values, based on visual estimation):
1. **Green Diamond:** DSP ≈ 0.00, Error ≈ 0.49
2. **Red Triangle:** DSP ≈ 0.05, Error ≈ 0.37
3. **Purple Square:** DSP ≈ 0.00, Error ≈ 0.44
4. **Light Blue Circle:** DSP ≈ 0.10, Error ≈ 0.34
5. **Yellow Star:** DSP ≈ 0.02, Error ≈ 0.48
6. **Brown Hexagon:** DSP ≈ 0.00, Error ≈ 0.38
7. **Olive Green Star:** DSP ≈ 0.00, Error ≈ 0.37
8. **Beige Triangle:** DSP ≈ 0.05, Error ≈ 0.35
Within the zoomed-in section:
* **Yellow Square:** DSP ≈ 0.00, Error ≈ 0.380
* **Dark Star:** DSP ≈ 0.00, Error ≈ 0.375
**Trends:**
* Generally, as Statistical Parity (DSP) increases, the Error (1-AUC) tends to decrease. However, this trend is not strictly linear and exhibits considerable variation.
* There is a concentration of points around DSP = 0.00, with a wide range of Error values.
* The zoomed-in section shows a cluster of points with low DSP and relatively low Error.
### Key Observations
* The data points are widely dispersed, indicating a complex relationship between Statistical Parity and Error.
* The zoomed-in section suggests that achieving very low DSP may be associated with lower Error, but this is not universally true across the entire dataset.
* The variation in Error values for a given DSP suggests that other factors may be influencing the model's performance.
### Interpretation
This scatter plot likely represents the performance of different machine learning models or algorithms used in Law School Admissions, evaluated based on two key fairness metrics: Statistical Parity and Error.
* **Statistical Parity (DSP)** measures the extent to which the model's predictions are independent of sensitive attributes (e.g., race, gender). A DSP of 0 indicates perfect parity, meaning the model's predictions are equally distributed across different groups.
* **Error (1-AUC)** represents the overall accuracy of the model, with lower values indicating better performance.
The plot suggests a trade-off between fairness (Statistical Parity) and accuracy (Error). Achieving higher Statistical Parity (moving to the right on the x-axis) generally leads to increased Error (moving down on the y-axis), and vice versa. This is a common phenomenon in fairness-aware machine learning, where attempts to mitigate bias can sometimes come at the cost of overall accuracy.
The zoomed-in section highlights a region where models achieve both relatively low DSP and low Error, suggesting that it may be possible to find models that perform well on both metrics. However, the wide dispersion of data points indicates that this is not always the case, and careful consideration must be given to the specific context and goals of the application.
The presence of outliers (points that deviate significantly from the general trend) suggests that certain models or algorithms may be particularly sensitive to specific data characteristics or biases. Further investigation would be needed to understand the reasons for these outliers and to determine whether they represent genuine opportunities for improvement or simply artifacts of the data.