## Scatter Plot: Perceived vs. Intended Angle Delta
### Overview
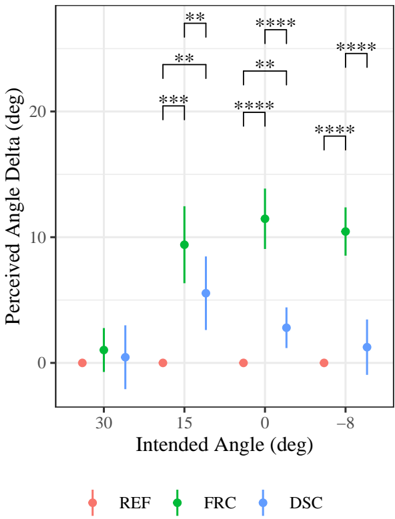
The image is a scatter plot comparing perceived angle delta (y-axis) to intended angle (x-axis) across three experimental conditions: REF (red), FRC (green), and DSC (blue). Error bars represent variability, and asterisks denote statistical significance levels.
### Components/Axes
- **X-axis (Intended Angle, deg)**: Ranges from -8° to 30°, with labeled ticks at -8, 0, 15, and 30.
- **Y-axis (Perceived Angle Delta, deg)**: Ranges from 0° to 25°, with increments of 5°.
- **Legend**: Located at the bottom, mapping colors to conditions:
- Red: REF
- Green: FRC
- Blue: DSC
- **Error Bars**: Vertical lines with caps, indicating standard deviation or confidence intervals.
- **Asterisks**: Placed above data points to denote statistical significance (e.g., **, ***, *).
### Detailed Analysis
#### REF (Red)
- **Trend**: Stable, near-zero perceived angle delta across all intended angles.
- **Data Points**:
- -8°: ~0° (±1°)
- 0°: ~0° (±1°)
- 15°: ~0° (±1°)
- 30°: ~0° (±1°)
- **Significance**: No asterisks; no significant deviation from intended angle.
#### FRC (Green)
- **Trend**: Perceived angle delta increases with intended angle magnitude.
- **Data Points**:
- -8°: ~10° (±3°)
- 0°: ~12° (±4°)
- 15°: ~9° (±3°)
- 30°: ~15° (±5°)
- **Significance**:
- 30°: *** (p < 0.001)
- 15°: ** (p < 0.01)
- 0°: * (p < 0.05)
- -8°: No asterisk.
#### DSC (Blue)
- **Trend**: Moderate perceived angle delta, less variable than FRC.
- **Data Points**:
- -8°: ~2° (±2°)
- 0°: ~4° (±3°)
- 15°: ~6° (±4°)
- 30°: ~3° (±2°)
- **Significance**:
- 15°: ** (p < 0.01)
- 0°: * (p < 0.05)
- -8° and 30°: No asterisks.
### Key Observations
1. **REF** consistently perceives angles accurately (near-zero delta).
2. **FRC** shows the largest perceptual errors, especially at extreme angles (30° and -8°).
3. **DSC** exhibits moderate errors, with significant deviations at 15° and 0°.
4. Asterisks cluster at 30°, 15°, and 0°, suggesting systematic differences between conditions at these angles.
### Interpretation
The data demonstrates that perceptual accuracy varies by experimental condition. **FRC** participants overestimate angles more severely at extremes (30° and -8°), while **DSC** shows smaller but statistically significant errors at mid-angles (15° and 0°). **REF** serves as a baseline with minimal deviation, indicating controlled conditions or higher precision. The asterisks imply that differences between groups are statistically significant at key angles, highlighting potential biases in perceptual processing under different experimental setups. This could inform studies on sensory adaptation, cognitive load, or measurement error in angular perception tasks.