## Bar Chart: Tool Call Cost/Frequency Analysis
### Overview
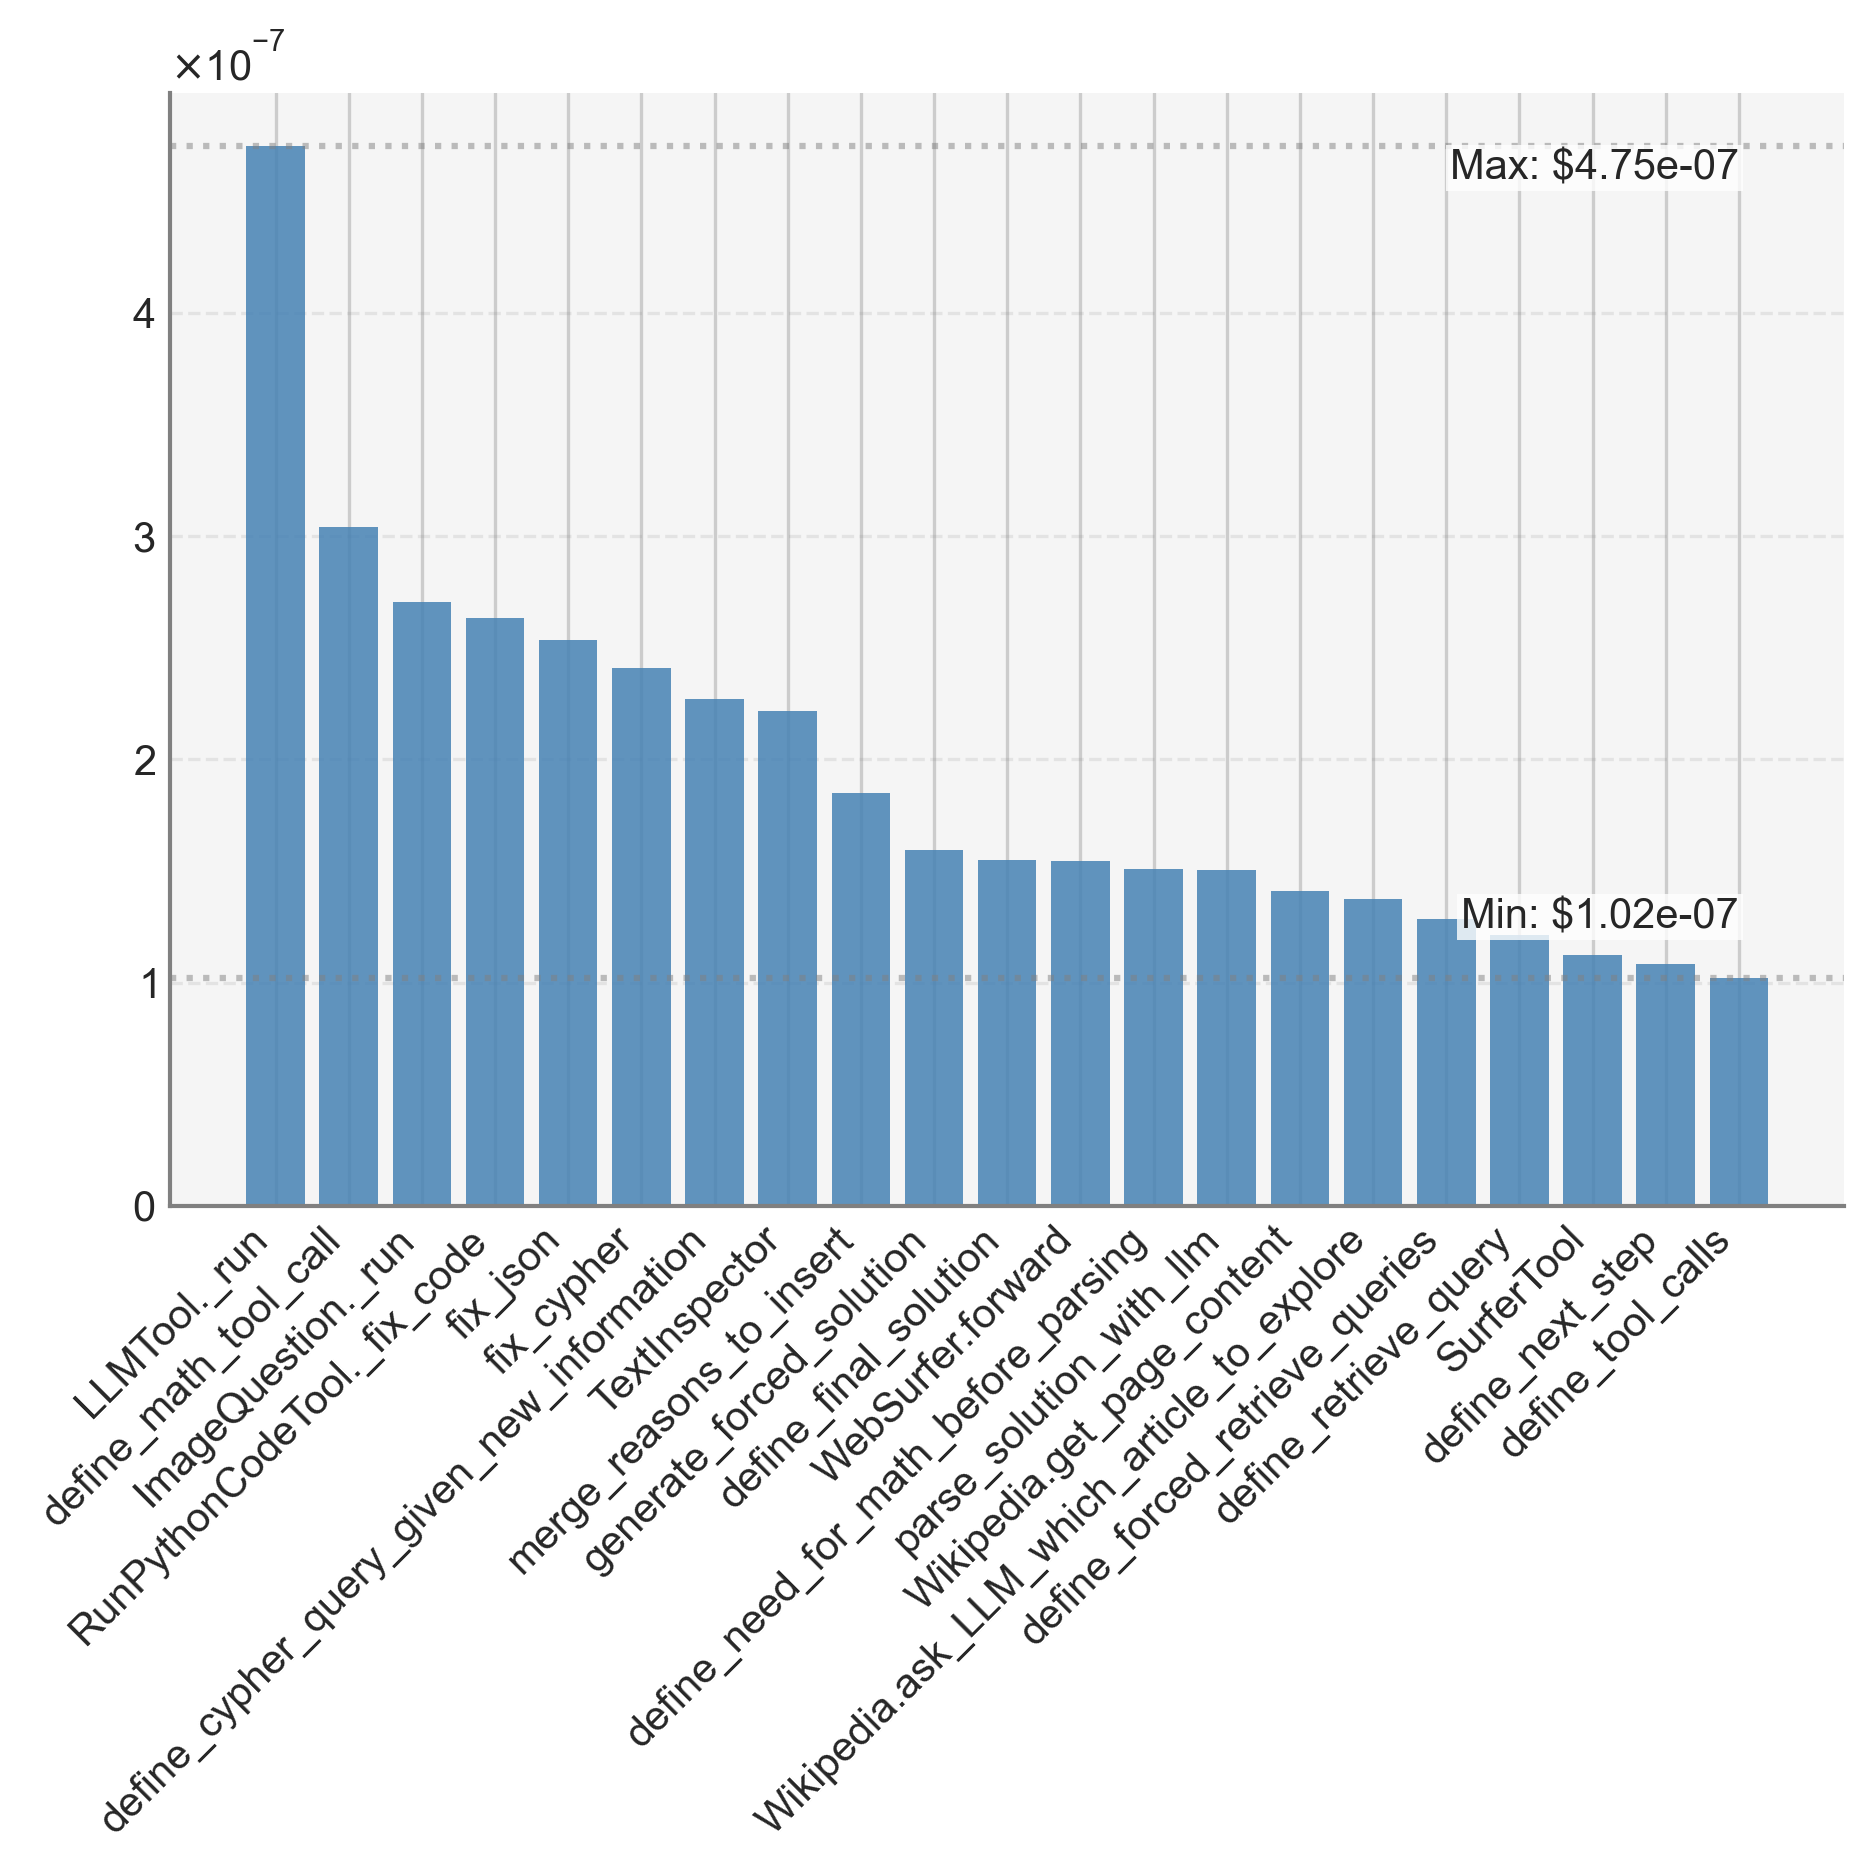
The image displays a vertical bar chart illustrating the relative cost or frequency (indicated by values on the y-axis) of 20 different tool calls or function names, likely from an AI or software system. The data is presented in descending order from left to right. The y-axis uses a logarithmic scale multiplier of ×10⁻⁷.
### Components/Axes
* **Y-Axis:**
* **Label:** `×10⁻⁷` (indicating all y-axis values should be multiplied by 10⁻⁷).
* **Scale:** Linear scale from 0 to 4, with major gridlines at 0, 1, 2, 3, and 4.
* **Annotations:**
* Top-right corner: `Max: $4.75e-07` (corresponding to the tallest bar).
* Bottom-right corner: `Min: $1.02e-07` (corresponding to the shortest bar).
* **X-Axis:**
* **Labels:** 20 distinct tool/function names, listed below from left (highest value) to right (lowest value). The labels are rotated approximately 45 degrees for readability.
* **Categories (in order):**
1. `LLMTool._run`
2. `define_math_tool_call`
3. `ImageQuestion._run`
4. `RunPythonCodeTool._fix_code`
5. `fix_json`
6. `fix_cypher`
7. `define_cypher_query_given_new_information`
8. `merge_reasons_to_insert`
9. `TextInspector`
10. `generate_forced_solution`
11. `define_final_solution`
12. `WebSurfer.forward`
13. `define_need_for_math_before_parsing`
14. `parse_solution_with_llm`
15. `Wikipedia.get_page_content`
16. `Wikipedia.ask_LLM_which_article_to_explore`
17. `define_forced_retrieve_queries`
18. `define_retrieve_query`
19. `SurferTool`
20. `define_next_step`
21. `define_tool_calls` *(Note: There are 21 labels but 20 bars. The label `define_tool_calls` appears to be the final, shortest bar, making the total count 20 bars for 20 labels. The list above includes all 20 labels in order.)*
* **Legend:** There is no separate legend. The x-axis labels serve as the category identifiers for each bar.
* **Visual Elements:** All bars are a uniform medium blue color. The chart has a light grey background with faint horizontal gridlines.
### Detailed Analysis
* **Trend:** The data shows a clear, consistent downward trend from left to right. The first bar (`LLMTool._run`) is significantly taller than all others, and the bar heights decrease monotonically.
* **Approximate Values (y-axis value × 10⁻⁷):**
* **Highest Value:** `LLMTool._run` aligns with the annotated maximum of **~4.75** (or $4.75e-07).
* **Second Tier:** The next three bars (`define_math_tool_call`, `ImageQuestion._run`, `RunPythonCodeTool._fix_code`) range from approximately **3.0** down to **2.6**.
* **Middle Tier:** The following group (`fix_json` through `generate_forced_solution`) descends from about **2.5** to **1.8**.
* **Lower Tier:** The remaining bars (`define_final_solution` through `define_tool_calls`) cluster between approximately **1.6** and the annotated minimum of **1.02** (or $1.02e-07).
* **Distribution:** The distribution is right-skewed. The top 5-6 tools account for a disproportionately large share of the total value (cost/frequency), while the bottom half of the tools have relatively similar, low values.
### Key Observations
1. **Dominant Tool:** `LLMTool._run` is a clear outlier, with a value nearly 50% higher than the second-ranked tool (`define_math_tool_call`). This suggests it is the most resource-intensive or frequently called function by a significant margin.
2. **Clustering:** Tools can be loosely grouped into tiers based on their values:
* **Tier 1 (High):** `LLMTool._run`
* **Tier 2 (Medium-High):** `define_math_tool_call`, `ImageQuestion._run`, `RunPythonCodeTool._fix_code`
* **Tier 3 (Medium):** `fix_json`, `fix_cypher`, `define_cypher_query_given_new_information`, `merge_reasons_to_insert`, `TextInspector`
* **Tier 4 (Low):** The remaining 11 tools, all with values below ~1.8 × 10⁻⁷.
3. **Functional Grouping:** The tool names suggest different functionalities:
* **Core LLM/Execution:** `LLMTool._run`, `define_math_tool_call`, `ImageQuestion._run`, `RunPythonCodeTool._fix_code`.
* **Data/Query Manipulation:** `fix_json`, `fix_cypher`, `define_cypher_query...`.
* **Reasoning & Solution Generation:** `merge_reasons...`, `generate_forced_solution`, `define_final_solution`.
* **External Knowledge & Navigation:** `WebSurfer.forward`, `Wikipedia.get_page_content`, `Wikipedia.ask_LLM...`, `SurferTool`.
* **Planning & Parsing:** `define_need_for_math...`, `parse_solution...`, `define_next_step`, `define_tool_calls`.
### Interpretation
This chart likely visualizes the **computational cost (e.g., in dollars or compute units) or invocation frequency** of various tools within an AI agent or complex software system. The data suggests a hierarchy of resource consumption:
* **Primary Driver:** The core Large Language Model tool (`LLMTool._run`) is the dominant cost/frequency center. This is logical, as it likely handles the central reasoning and generation tasks.
* **Specialized Tools:** Tools for specific tasks like math, image questions, and code execution form the next tier, indicating they are significant but secondary to the core LLM.
* **Supporting Functions:** A long tail of tools for data fixing, query definition, web navigation, and planning have lower, more uniform costs. This implies they are called less often or are less computationally expensive per call.
* **System Design Insight:** The steep drop-off after the first few tools indicates that optimizing the system's overall efficiency would yield the highest returns by focusing on the `LLMTool._run` and the top 4-5 tools. The long tail of lower-cost tools, while numerous, contributes less to the total aggregate cost/frequency.
**Note on Language:** All text in the image is in English. The values use standard scientific notation (e.g., `e-07`).