## Chart: Delta SNR vs. Eta
### Overview
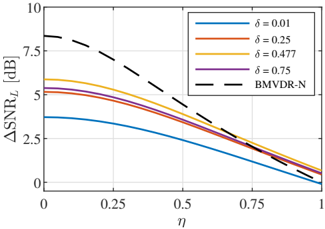
The image is a line chart comparing the change in Signal-to-Noise Ratio (ΔSNR_L) in decibels (dB) as a function of a variable η. There are four solid lines representing different values of δ (0.01, 0.25, 0.477, and 0.75) and one dashed line representing BMVDR-N. The chart shows how ΔSNR_L changes as η increases from 0 to 1.
### Components/Axes
* **X-axis (Horizontal):** η, ranging from 0 to 1 in increments of 0.25.
* **Y-axis (Vertical):** ΔSNR_L [dB], ranging from 0 to 10 in increments of 2.5.
* **Legend (Top-Right):**
* Blue line: δ = 0.01
* Orange line: δ = 0.25
* Yellow line: δ = 0.477
* Purple line: δ = 0.75
* Black dashed line: BMVDR-N
### Detailed Analysis
* **Blue line (δ = 0.01):** Starts at approximately 3.7 dB at η = 0 and decreases to approximately 0 dB at η = 1. The line slopes downward consistently.
* **Orange line (δ = 0.25):** Starts at approximately 6.2 dB at η = 0 and decreases to approximately 0.2 dB at η = 1. The line slopes downward consistently.
* **Yellow line (δ = 0.477):** Starts at approximately 6.8 dB at η = 0 and decreases to approximately 0.2 dB at η = 1. The line slopes downward consistently.
* **Purple line (δ = 0.75):** Starts at approximately 6.2 dB at η = 0 and decreases to approximately 0 dB at η = 1. The line slopes downward consistently.
* **Black dashed line (BMVDR-N):** Starts at approximately 8.8 dB at η = 0 and decreases to approximately 0 dB at η = 1. The line slopes downward consistently.
### Key Observations
* All lines show a decreasing trend in ΔSNR_L as η increases.
* The BMVDR-N (black dashed line) consistently has the highest ΔSNR_L for any given value of η.
* The lines for δ = 0.25, δ = 0.477, and δ = 0.75 are very close to each other.
* The line for δ = 0.01 has the lowest ΔSNR_L for any given value of η.
### Interpretation
The chart illustrates the relationship between ΔSNR_L and η for different values of δ and the BMVDR-N method. The decreasing trend suggests that as η increases, the improvement in SNR decreases. The BMVDR-N method consistently outperforms the other methods (different δ values) in terms of ΔSNR_L. The proximity of the lines for δ = 0.25, δ = 0.477, and δ = 0.75 suggests that the value of δ has a diminishing effect on ΔSNR_L beyond a certain point. The data suggests that BMVDR-N is the preferred method for maximizing the change in SNR.