## Diagram: Bayesian Teaching Process for Multi-Domain Recommendation Systems
### Overview
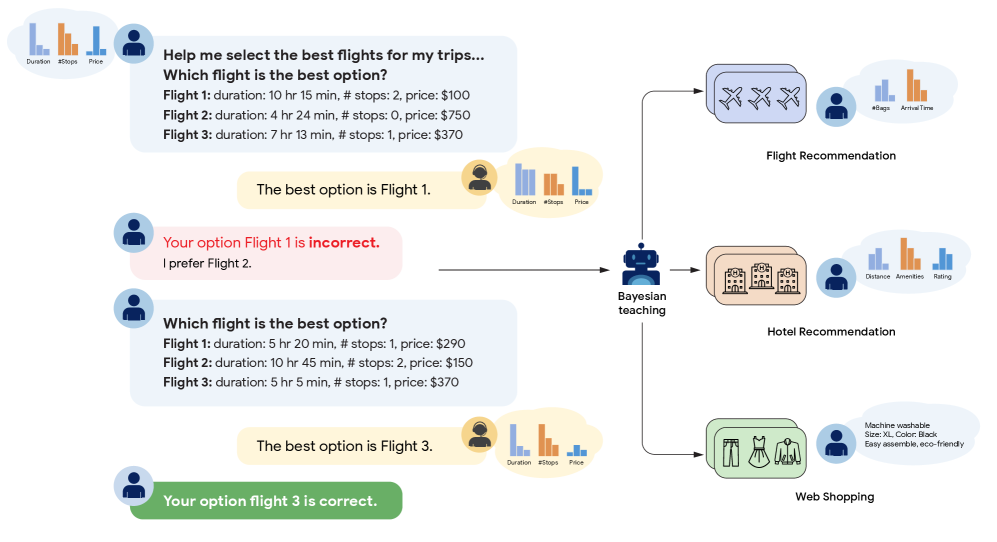
The image is a flowchart illustrating a "Bayesian teaching" process where a user provides feedback on an AI's recommendations, and this feedback is used to improve recommendations across multiple domains (flights, hotels, web shopping). The diagram shows two iterative cycles of user interaction for flight selection, followed by the application of learned preferences to other recommendation tasks.
### Components/Axes
The diagram is organized into three main regions:
1. **Left Column (User Interaction Loop):** Contains user queries (blue speech bubbles), system recommendations (yellow bubbles), and user feedback (red/green bubbles). Each interaction is accompanied by a small bar chart icon representing the features considered.
2. **Central Node:** A robot icon labeled **"Bayesian teaching"** acts as the learning hub, connecting the user feedback to the recommendation domains.
3. **Right Column (Recommendation Domains):** Three distinct application areas, each with an icon, a label, and a bar chart icon showing relevant features.
* **Top:** **Flight Recommendation** (airplane icons). Feature chart labels: `#Stops`, `Arrival Time`.
* **Middle:** **Hotel Recommendation** (building icons). Feature chart labels: `Distance`, `Amenities`, `Rating`.
* **Bottom:** **Web Shopping** (clothing icons). Feature chart labels: `Machine washable`, `Size: XL`, `Color: Black`, `Easy assemble`, `eco-friendly`.
### Detailed Analysis
**User Interaction Cycle 1 (Top-Left):**
* **User Query:** "Help me select the best flights for my trips... Which flight is the best option?"
* **Flight 1:** duration: 10 hr 15 min, # stops: 2, price: $100
* **Flight 2:** duration: 4 hr 24 min, # stops: 0, price: $750
* **Flight 3:** duration: 7 hr 13 min, # stops: 1, price: $370
* **System Recommendation (Yellow Bubble):** "The best option is Flight 1." Accompanied by a bar chart icon with three bars (blue, orange, gray) labeled `Duration`, `#Stops`, `Price`.
* **User Feedback (Red Bubble):** "Your option Flight 1 is incorrect. I prefer Flight 2."
**User Interaction Cycle 2 (Bottom-Left):**
* **User Query:** "Which flight is the best option?"
* **Flight 1:** duration: 5 hr 20 min, # stops: 1, price: $290
* **Flight 2:** duration: 10 hr 45 min, # stops: 2, price: $150
* **Flight 3:** duration: 5 hr 5 min, # stops: 1, price: $370
* **System Recommendation (Yellow Bubble):** "The best option is Flight 3." Accompanied by a bar chart icon.
* **User Feedback (Green Bubble):** "Your option flight 3 is correct."
**Central Process:**
* Arrows from both user feedback bubbles point to the central **"Bayesian teaching"** node.
* From this node, arrows point to the three recommendation domains on the right, indicating the learned preferences are applied here.
**Web Shopping Details (Bottom-Right):**
* Contains a block of text with mixed English and Chinese.
* **English Text:** `Machine washable`, `Size: XL`, `Color: Black`, `Easy assemble`, `eco-friendly`
* **Chinese Text (Transcribed):** `可机洗` (kě jī xǐ), `尺寸: XL` (chǐcùn: XL), `颜色: 黑色` (yánsè: hēisè), `易于组装` (yìyú zǔzhuāng), `环保` (huánbǎo)
* **English Translation of Chinese Text:** `Machine washable`, `Size: XL`, `Color: Black`, `Easy to assemble`, `Eco-friendly`
### Key Observations
1. **Feedback-Driven Learning:** The core mechanism is explicit user correction. The system makes a recommendation, the user provides binary feedback (correct/incorrect) and sometimes a preferred alternative, which is used for Bayesian updating.
2. **Feature-Based Representation:** Every decision point (user query, system recommendation) is paired with a bar chart icon, emphasizing that recommendations are based on weighted features (e.g., Duration, Price, #Stops).
3. **Cross-Domain Transfer:** The diagram explicitly shows that learning from flight selection interactions is transferred via "Bayesian teaching" to improve Hotel and Web Shopping recommendations.
4. **Multilingual Content:** The Web Shopping domain includes product attributes in both English and Chinese, suggesting the system operates in or supports a multilingual context.
5. **Visual Feedback Coding:** User feedback is color-coded: red for incorrect, green for correct, providing immediate visual cues about the learning signal.
### Interpretation
This diagram illustrates a human-in-the-loop machine learning framework, specifically **Bayesian teaching**, where user feedback directly shapes the model's understanding of preferences. The process is not just about optimizing a single task (flight selection) but about extracting generalizable preference rules that can be applied to novel domains (hotels, shopping).
The two flight examples show the system learning from its mistakes. In the first, it prioritized low price (Flight 1), but the user preferred the faster, non-stop option (Flight 2). In the second, after presumably updating its model, it correctly recommends the shortest flight (Flight 3). The bar chart icons suggest the system is learning the relative importance (weights) of features like duration versus price.
The transfer to other domains implies the learned preferences are abstract. For instance, a user's demonstrated preference for "convenience" (shorter duration, fewer stops) in flights might translate to prioritizing "proximity" (Distance) or "Amenities" in hotels, or "Easy assemble" in products. The inclusion of Chinese text in the shopping domain highlights the practical application of such a system in real-world, multilingual e-commerce platforms. The overall message is that interactive feedback is a powerful tool for building adaptable, multi-purpose recommendation agents.