## Diagram: State Transition Diagram
### Overview
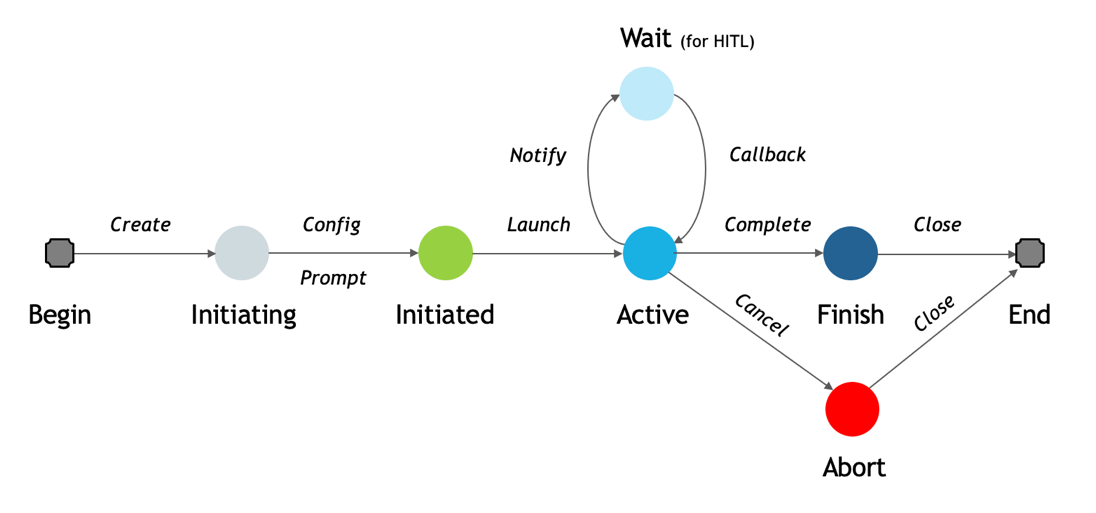
The image is a state transition diagram illustrating the lifecycle of a process, possibly related to software or system execution. It depicts various states, transitions between them, and associated actions.
### Components/Axes
* **Nodes (States):**
* Begin (Gray square)
* Initiating (Light gray circle)
* Initiated (Green circle)
* Active (Light blue circle)
* Wait (for HITL) (Very light blue circle)
* Finish (Dark blue circle)
* Abort (Red circle)
* End (Gray square)
* **Edges (Transitions):** Arrows indicating the flow between states.
* **Labels:** Text describing the states and the actions that trigger the transitions.
### Detailed Analysis or ### Content Details
1. **Begin** (Gray square): The starting point of the process.
* Transition: "Create" to Initiating.
2. **Initiating** (Light gray circle): The process is being initialized.
* Transition: "Config/Prompt" to Initiated.
3. **Initiated** (Green circle): The process has been initialized.
* Transition: "Launch" to Active.
4. **Active** (Light blue circle): The process is actively running.
* Transition 1: "Complete" to Finish.
* Transition 2: "Cancel" to Abort.
* Transition 3: "Notify" to Wait (for HITL).
5. **Wait (for HITL)** (Very light blue circle): The process is waiting, possibly for human interaction (HITL - Human-in-the-Loop).
* Transition: "Callback" to Active.
6. **Finish** (Dark blue circle): The process has completed successfully.
* Transition: "Close" to End.
7. **Abort** (Red circle): The process has been terminated prematurely.
* Transition: "Close" to End.
8. **End** (Gray square): The terminal state of the process.
### Key Observations
* The diagram shows a linear progression from Begin to Initiating to Initiated to Active.
* The Active state has multiple outgoing transitions, indicating branching possibilities (successful completion, cancellation, or waiting).
* The Wait state loops back to the Active state, suggesting a potential for repeated waiting and activation.
* Both Finish and Abort states lead to the End state.
### Interpretation
The state transition diagram describes the lifecycle of a process, highlighting the different states it can be in and the events that cause transitions between these states. The process starts with initialization, proceeds to an active state, and can either finish successfully, be aborted, or enter a wait state. The diagram provides a clear visual representation of the process flow and the possible paths it can take. The "Wait (for HITL)" state suggests that human intervention might be required at some point during the process. The diagram is useful for understanding the process's behavior and for designing or troubleshooting the system it represents.