\n
## Scatter Plot: Response Time vs. Problem Size for gemini-2.0-flash-thinking-exp-01-21
### Overview
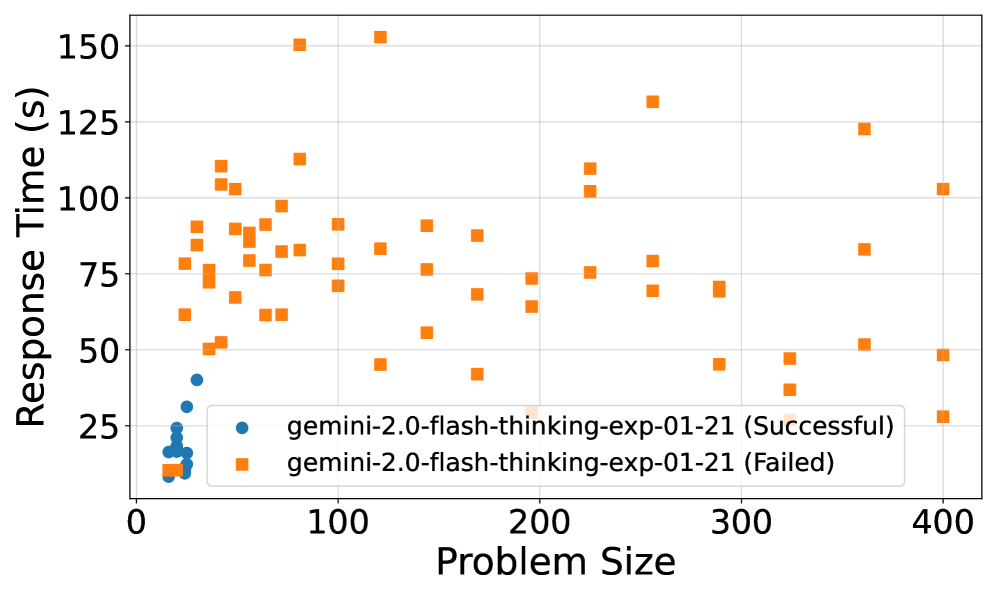
This is a scatter plot comparing the response time (in seconds) against problem size for two outcome categories of a model named "gemini-2.0-flash-thinking-exp-01-21". The plot visualizes the performance distribution for successful versus failed attempts.
### Components/Axes
* **Chart Type:** Scatter Plot.
* **X-Axis:** Labeled "Problem Size". The scale runs from 0 to 400, with major tick marks at 0, 100, 200, 300, and 400.
* **Y-Axis:** Labeled "Response Time (s)". The scale runs from 0 to 150, with major tick marks at 0, 25, 50, 75, 100, 125, and 150.
* **Legend:** Located in the bottom-left quadrant of the plot area. It contains two entries:
1. A blue circle symbol labeled `gemini-2.0-flash-thinking-exp-01-21 (Successful)`.
2. An orange square symbol labeled `gemini-2.0-flash-thinking-exp-01-21 (Failed)`.
### Detailed Analysis
**Data Series 1: Successful Attempts (Blue Circles)**
* **Trend Verification:** The data points form a tight cluster with a slight upward trend, confined to the lower-left corner of the plot.
* **Spatial Grounding & Data Points:** All blue circle points are located at very low problem sizes and low response times.
* **Problem Size Range:** Approximately 10 to 40.
* **Response Time Range:** Approximately 10 to 40 seconds.
* **Cluster Density:** The points are densely packed, with many overlapping, indicating consistent performance within this narrow band. The highest response time for a successful attempt appears to be just below 40 seconds.
**Data Series 2: Failed Attempts (Orange Squares)**
* **Trend Verification:** The data points are widely scattered across the entire plot area with no single, clear linear trend. There is a broad distribution.
* **Spatial Grounding & Data Points:** Orange square points are found across the full range of problem sizes and a wide range of response times.
* **Problem Size Range:** Spans from approximately 10 to 400.
* **Response Time Range:** Spans from approximately 10 to just over 150 seconds.
* **Distribution:** There is a high density of points between problem sizes 20-150 and response times 50-110s. Points become more sparse but remain present at higher problem sizes (200-400). Several outliers exist with very high response times (e.g., ~150s at problem size ~80 and ~120).
### Key Observations
1. **Clear Separation:** There is a stark visual separation between the two outcome clusters. Successful attempts are exclusively confined to a small region of low problem size and low response time.
2. **Performance Threshold:** No successful attempts are visible for problem sizes greater than approximately 40. This suggests a potential performance or capability threshold for the model in this test.
3. **High Variability in Failures:** Failed attempts show enormous variability in both problem size and response time. A failure can occur quickly on a small problem or take a very long time on a large problem.
4. **Overlap at Low End:** At the very lowest problem sizes (~10-20) and response times (~10-20s), there is some overlap between the blue and orange markers, indicating that both successes and failures can occur under similar, minimal conditions.
### Interpretation
The data suggests a strong correlation between problem complexity (size) and the model's ability to succeed. The model "gemini-2.0-flash-thinking-exp-01-21" appears to reliably succeed only on a narrow band of small, simple problems, completing them quickly (under 40 seconds). Once the problem size exceeds a certain threshold (around 40), the model consistently fails, regardless of the time taken. The wide scatter of failed attempts indicates that failure mode is not predictable by problem size alone; some large problems fail quickly, while others take the maximum observed time. This pattern could indicate a fundamental limitation in the model's reasoning capacity or resource allocation for complex tasks, where it either solves the problem efficiently or enters a prolonged, unsuccessful processing state. The lack of any successful attempts in the mid-to-high problem size range is the most critical finding, pointing to a clear boundary in the model's effective operational domain for this specific task.